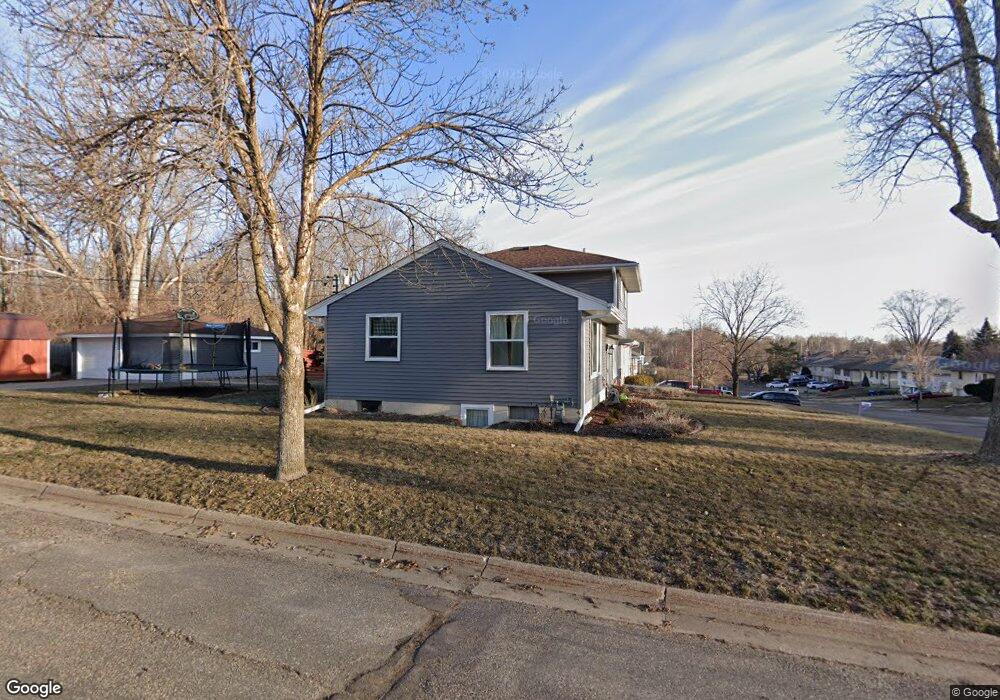
1156 9th Ave S South Saint Paul, MN 55075
Estimated Value: $318,000 - $336,000
4
Beds
2
Baths
1,650
Sq Ft
$198/Sq Ft
Est. Value
About This Home
This home is located at 1156 9th Ave S, South Saint Paul, MN 55075 and is currently estimated at $326,750, approximately $198 per square foot. 1156 9th Ave S is a home located in Dakota County with nearby schools including Kaposia Education Center Elementary, South St. Paul Middle School, and South St. Paul Secondary.
Ownership History
Date
Name
Owned For
Owner Type
Purchase Details
Closed on
Jul 31, 2018
Sold by
Dibble Carson J and Dibble Lindsay D
Bought by
Ewald Pamela A and Sontoya Joseph Anthony
Current Estimated Value
Purchase Details
Closed on
Dec 23, 2010
Sold by
Johansson Real Estate
Bought by
Dibble Carson J and Dibble Lindsay D
Purchase Details
Closed on
Mar 14, 2007
Sold by
Linder Anthony and Linder Kathryn
Bought by
Seaberg Thomas and Seaberg Jamie
Purchase Details
Closed on
Oct 31, 2006
Sold by
King George D and King Kathryn A
Bought by
Linder Anthony J
Purchase Details
Closed on
Nov 30, 2000
Sold by
King Steven and King Melanie
Bought by
King George D and King Kathryn A
Purchase Details
Closed on
Nov 1, 1997
Sold by
Lachapelle Kimm R
Bought by
King Steven E
Purchase Details
Closed on
Oct 30, 1997
Sold by
Brustad Morris O and Brustad Mabel
Bought by
Lachapelle Kimm R
Create a Home Valuation Report for This Property
The Home Valuation Report is an in-depth analysis detailing your home's value as well as a comparison with similar homes in the area
Home Values in the Area
Average Home Value in this Area
Purchase History
| Date | Buyer | Sale Price | Title Company |
|---|---|---|---|
| Ewald Pamela A | $254,000 | Results Title | |
| Dibble Carson J | $177,500 | Edina Realty Title | |
| Dibble Carson J | $177,500 | Edina Realty Title | |
| Seaberg Thomas | $242,900 | -- | |
| Linder Anthony J | $185,000 | -- | |
| King George D | $140,000 | -- | |
| King Steven E | -- | -- | |
| Lachapelle Kimm R | $119,000 | -- |
Source: Public Records
Tax History Compared to Growth
Tax History
| Year | Tax Paid | Tax Assessment Tax Assessment Total Assessment is a certain percentage of the fair market value that is determined by local assessors to be the total taxable value of land and additions on the property. | Land | Improvement |
|---|---|---|---|---|
| 2024 | $4,242 | $316,500 | $74,000 | $242,500 |
| 2023 | $4,390 | $310,600 | $74,400 | $236,200 |
| 2022 | $3,900 | $311,100 | $68,500 | $242,600 |
| 2021 | $3,436 | $270,000 | $59,600 | $210,400 |
| 2020 | $3,652 | $254,300 | $56,800 | $197,500 |
| 2019 | $2,881 | $241,600 | $54,100 | $187,500 |
| 2018 | $2,658 | $214,200 | $49,100 | $165,100 |
| 2017 | $2,283 | $192,400 | $46,800 | $145,600 |
| 2016 | $2,256 | $172,700 | $42,600 | $130,100 |
| 2015 | $2,095 | $142,392 | $34,993 | $107,399 |
| 2014 | -- | $140,212 | $34,881 | $105,331 |
| 2013 | -- | $151,300 | $35,700 | $115,600 |
Source: Public Records
Map
Nearby Homes
- 5472 Bryce Ave
- 928 8th Ave S
- 233 Richmond St W
- 1434 8th Ave S
- 4970 Boyd Ave
- 1436 5th Ave S
- 235 9th St S
- 101 Frost St W
- 100 W Warburton St
- 5903 Bryant Ln
- 5870 Blackberry Bridge Path
- 5938 Burke Trail
- 4898 Bitterman Path Unit 9101
- 2905 60th St E
- 4852 Bisset Ln Unit 9504
- 137 South St E
- 227 Dale St E
- 6050 Cahill Ave
- 531 12th Ave S
- 4680 Bloomberg Ln
- 1156 1156 9th Ave S
- 1148 9th Ave S
- 1200 9th Ave S
- 1142 9th Ave S
- 1208 9th Ave S
- 1138 9th Ave S
- 1159 9th Ave S
- 1151 9th Ave S
- 1212 9th Ave S
- 1147 9th Ave S
- 1134 9th Ave S
- 1212 9th Ave S
- 1201 9th Ave S
- 1141 1141 9th-Avenue-s
- 1141 9th Ave S
- 1209 9th Ave S
- 1130 9th Ave S
- 1209 1209 9th Ave S
- 1137 9th Ave S
- 1216 9th Ave S