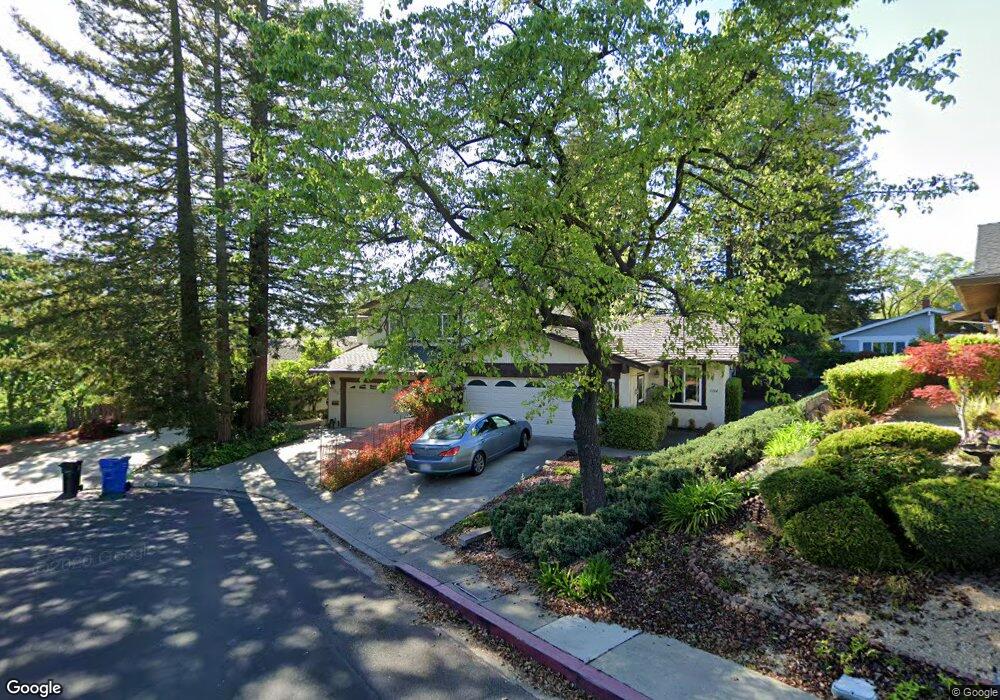
1156 Covington Ct Walnut Creek, CA 94596
Estimated Value: $1,065,000 - $1,375,000
4
Beds
3
Baths
2,303
Sq Ft
$535/Sq Ft
Est. Value
About This Home
This home is located at 1156 Covington Ct, Walnut Creek, CA 94596 and is currently estimated at $1,232,493, approximately $535 per square foot. 1156 Covington Ct is a home located in Contra Costa County with nearby schools including Murwood Elementary School, Walnut Creek Intermediate School, and Las Lomas High School.
Ownership History
Date
Name
Owned For
Owner Type
Purchase Details
Closed on
Apr 22, 2013
Sold by
Kogan Viktor and Kogan Larisa
Bought by
Kogan Viktor and Kogan Larisa
Current Estimated Value
Purchase Details
Closed on
Dec 19, 1995
Sold by
Ivers Thomason Kathryn
Bought by
Thomason Brett
Home Financials for this Owner
Home Financials are based on the most recent Mortgage that was taken out on this home.
Original Mortgage
$204,000
Outstanding Balance
$4,178
Interest Rate
7.38%
Mortgage Type
Purchase Money Mortgage
Estimated Equity
$1,228,315
Purchase Details
Closed on
Dec 16, 1995
Sold by
Thomason Brett and Thomason Kristi
Bought by
Kogan Victor and Kogan Larisa
Home Financials for this Owner
Home Financials are based on the most recent Mortgage that was taken out on this home.
Original Mortgage
$204,000
Outstanding Balance
$4,178
Interest Rate
7.38%
Mortgage Type
Purchase Money Mortgage
Estimated Equity
$1,228,315
Create a Home Valuation Report for This Property
The Home Valuation Report is an in-depth analysis detailing your home's value as well as a comparison with similar homes in the area
Home Values in the Area
Average Home Value in this Area
Purchase History
| Date | Buyer | Sale Price | Title Company |
|---|---|---|---|
| Kogan Viktor | -- | None Available | |
| Thomason Brett | -- | American Title Ins Co | |
| Kogan Victor | $255,000 | American Title Ins Co |
Source: Public Records
Mortgage History
| Date | Status | Borrower | Loan Amount |
|---|---|---|---|
| Open | Kogan Victor | $204,000 |
Source: Public Records
Tax History Compared to Growth
Tax History
| Year | Tax Paid | Tax Assessment Tax Assessment Total Assessment is a certain percentage of the fair market value that is determined by local assessors to be the total taxable value of land and additions on the property. | Land | Improvement |
|---|---|---|---|---|
| 2025 | $5,278 | $423,592 | $274,091 | $149,501 |
| 2024 | $5,142 | $415,287 | $268,717 | $146,570 |
| 2023 | $5,142 | $407,146 | $263,449 | $143,697 |
| 2022 | $5,031 | $399,164 | $258,284 | $140,880 |
| 2021 | $5,266 | $391,338 | $253,220 | $138,118 |
| 2019 | $5,133 | $379,732 | $245,710 | $134,022 |
| 2018 | $4,961 | $372,288 | $240,893 | $131,395 |
| 2017 | $4,858 | $364,989 | $236,170 | $128,819 |
| 2016 | $4,753 | $357,834 | $231,540 | $126,294 |
| 2015 | $4,638 | $352,460 | $228,063 | $124,397 |
| 2014 | $4,571 | $345,557 | $223,596 | $121,961 |
Source: Public Records
Map
Nearby Homes
- 2409 Lavender Dr
- 1092 Hillendale Ct
- 31 Arabian Ct
- 1305 Chesterton Way
- 32 Pacer Place
- 1555 Pebblebrook Ct
- 2673 Velvet Way
- 2129 Youngs Ct
- 421 Twin Oaks Ln
- 716 Rosewood Dr
- 721 Fair Oaks Dr
- 420 Livorna Rd
- 1096 Mountain View Blvd
- 234 Acacia Ln
- 77 Pleasant Knoll Ct
- 628 Sugarloaf Ct
- 172 Rudgear Dr
- 189 Rudgear Dr
- 210 Likely Dr
- 47 Kentfield Ct
- 1148 Covington Ct
- 1164 Covington Ct
- 1172 Covington Ct
- 1141 Glengarry Dr
- 1139 Glengarry Dr
- 1137 Glengarry Dr
- 1143 Glengarry Dr
- 1180 Covington Ct
- 1145 Glengarry Dr
- 1175 Covington Ct
- 1188 Covington Ct
- 1191 Covington Ct
- 1136 Glengarry Dr
- 2254 Gladwin Dr
- 1140 Glengarry Dr
- 2252 Gladwin Dr
- 1142 Glengarry Dr
- 2256 Gladwin Dr
- 2258 Gladwin Dr
- 1144 Glengarry Dr