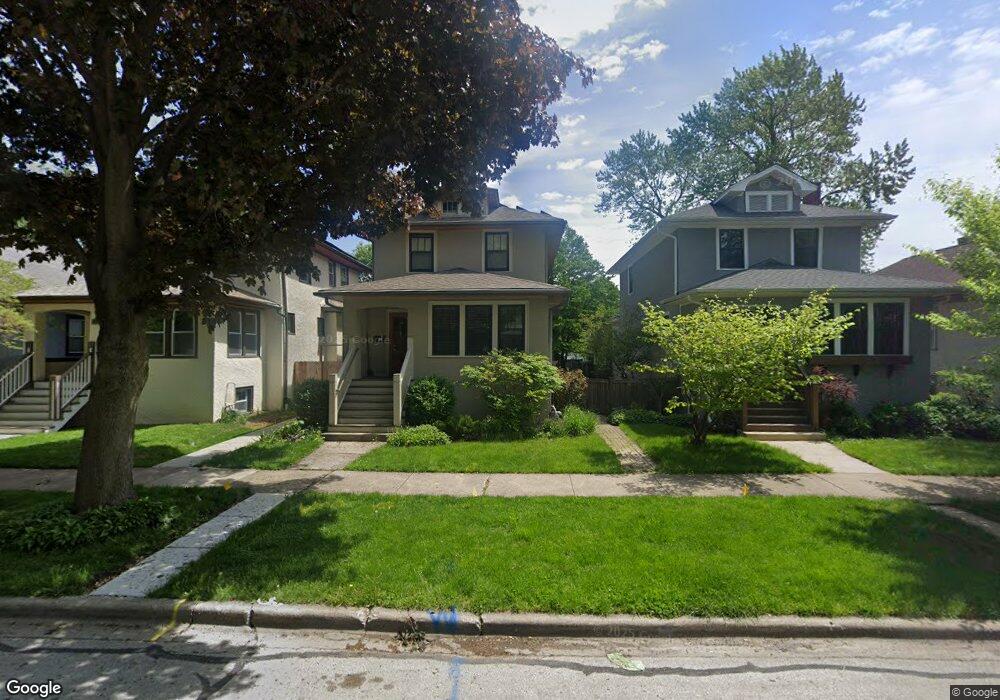
1156 Gunderson Ave Oak Park, IL 60304
Estimated Value: $526,034 - $569,000
3
Beds
2
Baths
1,580
Sq Ft
$346/Sq Ft
Est. Value
About This Home
This home is located at 1156 Gunderson Ave, Oak Park, IL 60304 and is currently estimated at $547,009, approximately $346 per square foot. 1156 Gunderson Ave is a home located in Cook County with nearby schools including Percy Julian Middle School, Oak Park and River Forest High School, and West Suburban Montessori School.
Ownership History
Date
Name
Owned For
Owner Type
Purchase Details
Closed on
Sep 4, 2025
Sold by
Miller Bart A and Jeschke Margaret C
Bought by
Margaret C Jeschke Declaration Of Trust and Jeschke
Current Estimated Value
Purchase Details
Closed on
Jul 9, 2001
Sold by
Tirone Peter A and Ryba Susan K
Bought by
Miller Bart A and Jeschke Margaret C
Home Financials for this Owner
Home Financials are based on the most recent Mortgage that was taken out on this home.
Original Mortgage
$265,600
Interest Rate
7.27%
Purchase Details
Closed on
May 6, 1994
Sold by
Nicholson Patrick B and Nicholson Virginia G
Bought by
Tirone Peter A and Ryba Susan K
Home Financials for this Owner
Home Financials are based on the most recent Mortgage that was taken out on this home.
Original Mortgage
$140,000
Interest Rate
8.08%
Create a Home Valuation Report for This Property
The Home Valuation Report is an in-depth analysis detailing your home's value as well as a comparison with similar homes in the area
Home Values in the Area
Average Home Value in this Area
Purchase History
| Date | Buyer | Sale Price | Title Company |
|---|---|---|---|
| Margaret C Jeschke Declaration Of Trust | -- | None Listed On Document | |
| Miller Bart A | $332,000 | Chicago Title Insurance Co | |
| Tirone Peter A | $160,000 | -- |
Source: Public Records
Mortgage History
| Date | Status | Borrower | Loan Amount |
|---|---|---|---|
| Previous Owner | Miller Bart A | $265,600 | |
| Previous Owner | Tirone Peter A | $140,000 |
Source: Public Records
Tax History Compared to Growth
Tax History
| Year | Tax Paid | Tax Assessment Tax Assessment Total Assessment is a certain percentage of the fair market value that is determined by local assessors to be the total taxable value of land and additions on the property. | Land | Improvement |
|---|---|---|---|---|
| 2024 | $13,589 | $45,000 | $6,174 | $38,826 |
| 2023 | $13,042 | $45,000 | $6,174 | $38,826 |
| 2022 | $13,042 | $37,385 | $4,631 | $32,754 |
| 2021 | $12,743 | $37,384 | $4,630 | $32,754 |
| 2020 | $12,515 | $37,384 | $4,630 | $32,754 |
| 2019 | $11,839 | $34,288 | $4,189 | $30,099 |
| 2018 | $11,393 | $34,288 | $4,189 | $30,099 |
| 2017 | $11,165 | $34,288 | $4,189 | $30,099 |
| 2016 | $12,070 | $32,485 | $3,528 | $28,957 |
| 2015 | $10,769 | $32,485 | $3,528 | $28,957 |
| 2014 | $10,025 | $32,485 | $3,528 | $28,957 |
| 2013 | $10,486 | $34,850 | $3,528 | $31,322 |
Source: Public Records
Map
Nearby Homes
- 1125 Gunderson Ave
- 1223 S Elmwood Ave Unit TWO
- 1133 S Ridgeland Ave
- 1183 S Scoville Ave
- 6337 Roosevelt Rd Unit 309
- 6337 Roosevelt Rd Unit 103
- 1141 Highland Ave
- 1243 Elmwood Ave
- 1156 Wesley Ave
- 1036 Highland Ave
- 1140 S Harvey Ave
- 1321 East Ave
- 1336 Cuyler Ave
- 1021 S Lombard Ave
- 1135 S Oak Park Ave
- 924 Wesley Ave Unit 2
- 1335 Wesley Ave
- 920 Wesley Ave Unit 1
- 1413 Cuyler Ave
- 1182 S Taylor Ave
- 1154 Gunderson Ave
- 1158 Gunderson Ave
- 1150 Gunderson Ave
- 1160 Gunderson Ave
- 1164 Gunderson Ave
- 1166 Gunderson Ave
- 1157 S Elmwood Ave
- 1153 S Elmwood Ave
- 1161 S Elmwood Ave
- 1151 S Elmwood Ave
- 1163 S Elmwood Ave
- 1168 Gunderson Ave
- 1165 S Elmwood Ave
- 1155 Gunderson Ave
- 1159 Gunderson Ave
- 1153 Gunderson Ave
- 1161 Gunderson Ave
- 1144 Gunderson Ave
- 1167 S Elmwood Ave
- 1151 Gunderson Ave