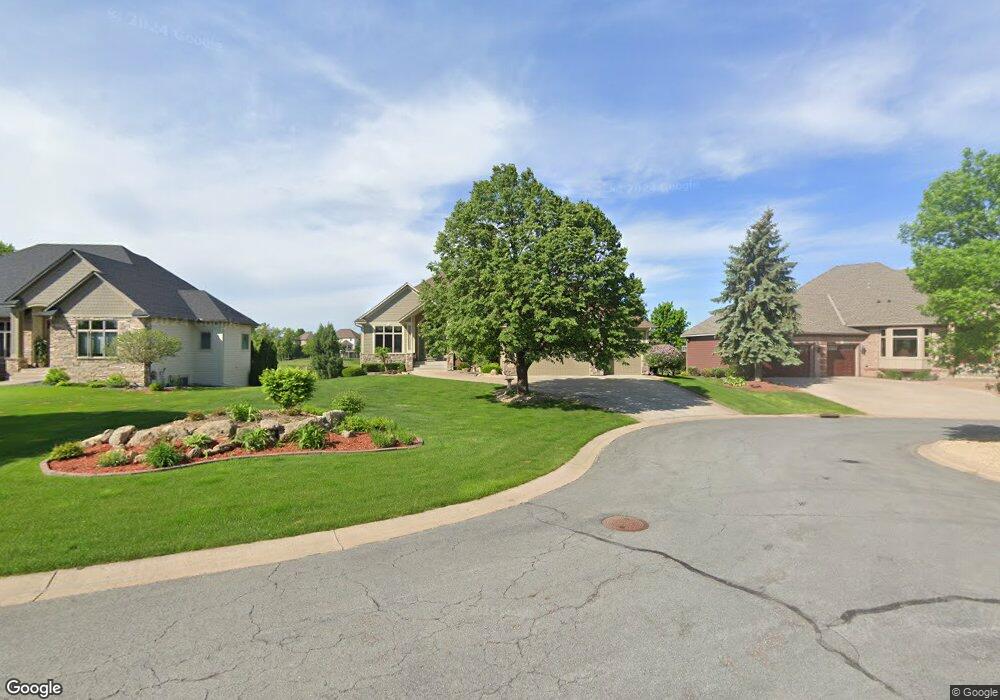
11561 Palisade Ct NE Minneapolis, MN 55449
Estimated Value: $728,495 - $777,000
3
Beds
3
Baths
2,008
Sq Ft
$375/Sq Ft
Est. Value
About This Home
This home is located at 11561 Palisade Ct NE, Minneapolis, MN 55449 and is currently estimated at $753,124, approximately $375 per square foot. 11561 Palisade Ct NE is a home located in Anoka County with nearby schools including Northpoint Elementary School, Westwood Intermediate and Middle School, and Cross of Christ Lutheran School.
Ownership History
Date
Name
Owned For
Owner Type
Purchase Details
Closed on
Dec 21, 2017
Sold by
Wyant Ralph R and Wyant Ronna L
Bought by
Steinert Kevin E and Manning Dawn M
Current Estimated Value
Home Financials for this Owner
Home Financials are based on the most recent Mortgage that was taken out on this home.
Original Mortgage
$422,400
Outstanding Balance
$355,255
Interest Rate
3.9%
Mortgage Type
New Conventional
Estimated Equity
$397,869
Purchase Details
Closed on
Aug 15, 2011
Sold by
Sarna James A
Bought by
Wyant Ralph R and Wyant Ronna L
Home Financials for this Owner
Home Financials are based on the most recent Mortgage that was taken out on this home.
Original Mortgage
$200,000
Interest Rate
4.55%
Mortgage Type
New Conventional
Purchase Details
Closed on
Nov 9, 2001
Sold by
Gorham Builders Inc
Bought by
Sarna James A
Purchase Details
Closed on
Dec 29, 2000
Sold by
Sienna Corp
Bought by
Gorham Builders Inc
Create a Home Valuation Report for This Property
The Home Valuation Report is an in-depth analysis detailing your home's value as well as a comparison with similar homes in the area
Home Values in the Area
Average Home Value in this Area
Purchase History
| Date | Buyer | Sale Price | Title Company |
|---|---|---|---|
| Steinert Kevin E | $528,000 | Alliance Title Llc | |
| Wyant Ralph R | $435,000 | -- | |
| Sarna James A | $482,650 | -- | |
| Gorham Builders Inc | $273,090 | -- |
Source: Public Records
Mortgage History
| Date | Status | Borrower | Loan Amount |
|---|---|---|---|
| Open | Steinert Kevin E | $422,400 | |
| Previous Owner | Wyant Ralph R | $200,000 |
Source: Public Records
Tax History Compared to Growth
Tax History
| Year | Tax Paid | Tax Assessment Tax Assessment Total Assessment is a certain percentage of the fair market value that is determined by local assessors to be the total taxable value of land and additions on the property. | Land | Improvement |
|---|---|---|---|---|
| 2025 | $7,873 | $689,200 | $119,500 | $569,700 |
| 2024 | $7,873 | $667,500 | $109,500 | $558,000 |
| 2023 | $6,608 | $670,800 | $109,500 | $561,300 |
| 2022 | $7,013 | $628,800 | $89,600 | $539,200 |
| 2021 | $6,752 | $581,300 | $82,000 | $499,300 |
| 2020 | $6,825 | $553,500 | $81,900 | $471,600 |
| 2019 | $6,417 | $536,300 | $69,000 | $467,300 |
| 2018 | $6,501 | $496,800 | $0 | $0 |
| 2017 | $6,300 | $487,300 | $0 | $0 |
| 2016 | $6,308 | $453,900 | $0 | $0 |
| 2015 | $6,504 | $453,900 | $86,400 | $367,500 |
| 2014 | -- | $401,900 | $92,300 | $309,600 |
Source: Public Records
Map
Nearby Homes
- 11505 Palisade Ct NE
- 2255 119th Cir NE
- 2070 120th Ave NE
- 2356 119th Cir NE
- 11258 Isanti Ct NE
- 12024 Owatonna Ct NE
- 1635 117th Ave NE
- 12041 Owatonna Ct NE
- 12051 Owatonna Ct NE
- 11240 Hastings St NE
- 11345 Fergus St NE Unit D
- 2429 121st Cir NE Unit F
- 2429 121st Cir NE Unit E
- 11305 Fergus St NE Unit F
- 11394 Eldorado St NE Unit E
- 1936 121st Ave NE
- 1611 Cloud Dr NE
- 11598 Yancy Ct NE
- 1842 111th Ave NE
- 12016 Vermillion St NE Unit D
- 11557 Palisade Ct NE
- 11573 Palisade Ct NE
- 11553 Palisade Ct NE
- 11545 Palisade Ct NE
- 11549 Palisade Ct NE
- 11577 Palisade Ct NE
- 11541 Palisade Ct NE
- 11537 Palisade Ct NE
- 11501 Palisade Ct NE
- 11533 Palisade Ct NE
- 11509 Palisade Ct NE
- 11529 Palisade Ct NE
- 11517 Palisade Ct NE
- 11467 Kenyon Ct NE
- 11469 Kenyon Ct NE
- 11471 Kenyon Ct NE
- 11465 Kenyon Ct NE
- 11463 Kenyon Ct NE
- 11521 Palisade Ct NE
- 11473 Kenyon Ct NE