11562 Rolling Grn Ct Unit 12/201 Reston, VA 20191
Estimated Value: $436,000
2
Beds
2
Baths
1,170
Sq Ft
$373/Sq Ft
Est. Value
About This Home
This home is located at 11562 Rolling Grn Ct Unit 12/201, Reston, VA 20191 and is currently estimated at $436,000, approximately $372 per square foot. 11562 Rolling Grn Ct Unit 12/201 is a home located in Fairfax County with nearby schools including Terraset Elementary, South Lakes High School, and Sunset Hills Montessori School.
Ownership History
Date
Name
Owned For
Owner Type
Purchase Details
Closed on
Aug 16, 2007
Sold by
Hoover Michael T
Bought by
Mag Real Estate Group Llc
Current Estimated Value
Purchase Details
Closed on
Jul 29, 2004
Sold by
Anderson Brian M
Bought by
Hoover Michael T
Home Financials for this Owner
Home Financials are based on the most recent Mortgage that was taken out on this home.
Original Mortgage
$244,861
Interest Rate
6.33%
Mortgage Type
New Conventional
Purchase Details
Closed on
May 14, 2002
Sold by
Smith Stephanie
Bought by
Anderson Brian
Home Financials for this Owner
Home Financials are based on the most recent Mortgage that was taken out on this home.
Original Mortgage
$120,000
Interest Rate
7.18%
Mortgage Type
New Conventional
Create a Home Valuation Report for This Property
The Home Valuation Report is an in-depth analysis detailing your home's value as well as a comparison with similar homes in the area
Home Values in the Area
Average Home Value in this Area
Purchase History
| Date | Buyer | Sale Price | Title Company |
|---|---|---|---|
| Mag Real Estate Group Llc | -- | -- | |
| Hoover Michael T | $257,750 | -- | |
| Anderson Brian | $150,000 | -- |
Source: Public Records
Mortgage History
| Date | Status | Borrower | Loan Amount |
|---|---|---|---|
| Previous Owner | Hoover Michael T | $244,861 | |
| Previous Owner | Anderson Brian | $120,000 |
Source: Public Records
Tax History Compared to Growth
Tax History
| Year | Tax Paid | Tax Assessment Tax Assessment Total Assessment is a certain percentage of the fair market value that is determined by local assessors to be the total taxable value of land and additions on the property. | Land | Improvement |
|---|---|---|---|---|
| 2025 | $4,544 | $346,800 | $69,000 | $277,800 |
| 2024 | $4,544 | $376,960 | $75,000 | $301,960 |
| 2023 | $3,921 | $333,590 | $67,000 | $266,590 |
| 2022 | $3,668 | $320,760 | $64,000 | $256,760 |
| 2021 | $3,625 | $297,000 | $59,000 | $238,000 |
| 2020 | $3,384 | $275,000 | $55,000 | $220,000 |
| 2019 | $3,133 | $254,630 | $48,000 | $206,630 |
| 2018 | $2,737 | $237,970 | $48,000 | $189,970 |
| 2017 | $2,964 | $245,330 | $49,000 | $196,330 |
| 2016 | $3,055 | $253,400 | $51,000 | $202,400 |
| 2015 | $2,947 | $253,400 | $51,000 | $202,400 |
| 2014 | $3,100 | $267,110 | $53,000 | $214,110 |
Source: Public Records
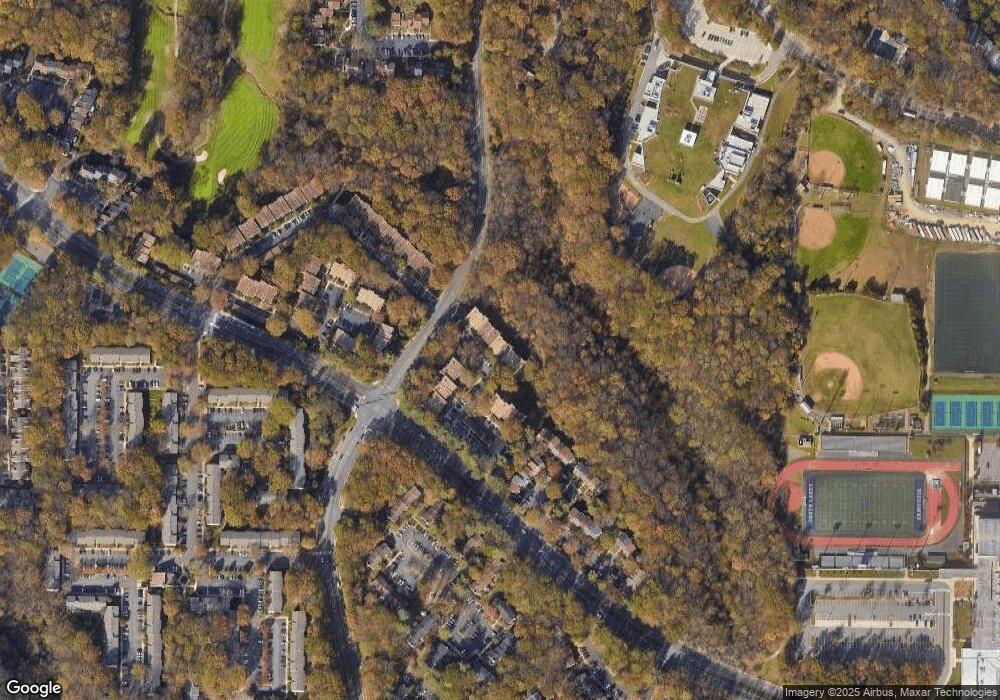
Map
Nearby Homes
- 11563 Ivy Bush Ct
- 11604 Ivystone Ct Unit 6
- 2118 Green Watch Way Unit 10/201C
- 11657 Stoneview Square Unit 97/22C
- 11659 Stoneview Square Unit 99/1B
- 2233 Lovedale Ln Unit I
- 2152 Glencourse Ln
- 11721 Karbon Hill Ct Unit T2
- 11709 Karbon Hill Ct Unit 606A
- 2318 Millennium Ln
- 11735 Ledura Ct Unit 201
- 11751 Mossy Creek Ln
- 2369 Old Trail Dr
- 11184 Silentwood Ln
- 11200 Silentwood Ln
- 2180 Whisperwood Glen Ln
- 2369 Generation Dr
- 2025 Winged Foot Ct
- 2218 Wakerobin Ln
- 2376 Generation Dr
- 11566 Rolling Green Ct Unit 201
- 11562 Rolling Green Ct Unit 201
- 11560 Rolling Green Ct Unit 201
- 11564 Rolling Green Ct Unit 101
- 11562 Rolling Green Ct Unit 100
- 11560 Rolling Green Ct Unit 300
- 11566 Rolling Green Ct Unit 200
- 11562 Rolling Green Ct Unit 300
- 11564 Rolling Green Ct Unit 100
- 11562 Rolling Green Ct Unit 301
- 11560 Rolling Green Ct Unit 301
- 11560 Rolling Green Ct Unit 200
- 11564 Rolling Green Ct Unit 201
- 11564 Rolling Green Ct Unit 301
- 11566 Rolling Green Ct Unit 12
- 11560 Rolling Green Ct Unit 12/301
- 11566 Rolling Green Ct Unit 100
- 11564 Rolling Green Ct Unit 300
- 11562 Rolling Green Ct Unit 200
- 11560 Rolling Grn Ct Unit 12/301