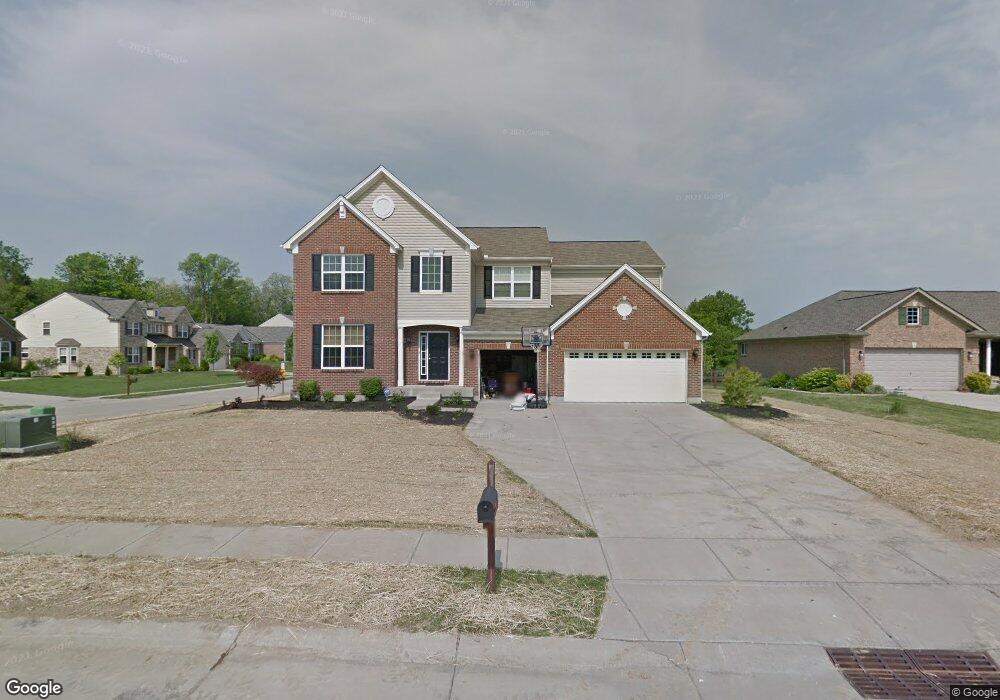
11565 Allaire Ct Independence, KY 41051
Estimated Value: $470,836 - $494,000
4
Beds
4
Baths
3,211
Sq Ft
$151/Sq Ft
Est. Value
About This Home
This home is located at 11565 Allaire Ct, Independence, KY 41051 and is currently estimated at $483,959, approximately $150 per square foot. 11565 Allaire Ct is a home located in Kenton County with nearby schools including Kenton Elementary School, Twenhofel Middle School, and Simon Kenton High School.
Ownership History
Date
Name
Owned For
Owner Type
Purchase Details
Closed on
Feb 27, 2013
Sold by
Martin Penelope A and Martin Joseph E
Bought by
Martin Penelope A
Current Estimated Value
Home Financials for this Owner
Home Financials are based on the most recent Mortgage that was taken out on this home.
Original Mortgage
$207,248
Outstanding Balance
$38,261
Interest Rate
3.43%
Mortgage Type
New Conventional
Estimated Equity
$445,698
Purchase Details
Closed on
Jun 30, 2008
Sold by
The Ryland Group Inc
Bought by
Martin Penelope A
Home Financials for this Owner
Home Financials are based on the most recent Mortgage that was taken out on this home.
Original Mortgage
$226,600
Interest Rate
5.96%
Mortgage Type
Purchase Money Mortgage
Purchase Details
Closed on
Mar 7, 2008
Sold by
Freedom Park Llc
Bought by
The Ryland Group Inc
Purchase Details
Closed on
Jun 12, 2007
Sold by
The Ryland Group Inc
Bought by
Freedom Park Llc
Purchase Details
Closed on
Jan 31, 2007
Sold by
Freedom Park Llc
Bought by
The Ryland Group Inc
Create a Home Valuation Report for This Property
The Home Valuation Report is an in-depth analysis detailing your home's value as well as a comparison with similar homes in the area
Home Values in the Area
Average Home Value in this Area
Purchase History
| Date | Buyer | Sale Price | Title Company |
|---|---|---|---|
| Martin Penelope A | -- | None Available | |
| Martin Penelope A | -- | Veritas Title Ltd | |
| Martin Penelope A | $266,604 | Imperial Title Services Llc | |
| The Ryland Group Inc | $42,204 | Imperial Title Services Llc | |
| Freedom Park Llc | $86,100 | Imperial Title Services Llc | |
| The Ryland Group Inc | $176,400 | Ryland Title Co |
Source: Public Records
Mortgage History
| Date | Status | Borrower | Loan Amount |
|---|---|---|---|
| Open | Martin Penelope A | $207,248 | |
| Closed | Martin Penelope A | $226,600 |
Source: Public Records
Tax History
| Year | Tax Paid | Tax Assessment Tax Assessment Total Assessment is a certain percentage of the fair market value that is determined by local assessors to be the total taxable value of land and additions on the property. | Land | Improvement |
|---|---|---|---|---|
| 2025 | $4,650 | $399,800 | $50,000 | $349,800 |
| 2024 | $3,958 | $323,100 | $40,000 | $283,100 |
| 2023 | $4,078 | $323,100 | $40,000 | $283,100 |
| 2022 | $4,128 | $323,100 | $40,000 | $283,100 |
| 2021 | $4,190 | $323,100 | $40,000 | $283,100 |
| 2020 | $3,653 | $275,000 | $40,000 | $235,000 |
| 2019 | $3,663 | $275,000 | $40,000 | $235,000 |
| 2018 | $3,683 | $275,000 | $40,000 | $235,000 |
| 2017 | $3,581 | $275,000 | $40,000 | $235,000 |
| 2015 | $3,380 | $266,600 | $42,200 | $224,400 |
| 2014 | $3,332 | $266,600 | $42,200 | $224,400 |
Source: Public Records
Map
Nearby Homes
- 11553 Allaire Ct
- 11556 Allaire Ct
- 65 Oby Dr
- 56 Apple Dr Unit A
- 1708 Relway Dr
- 11147 Stafford Heights Rd
- 93 Roselawn Dr
- 10737 Cypresswood Dr
- 8382 Greenmere Cir
- 1427 Rosewynne Way
- 1422 Greenoaks Dr
- 11061 Pinebrook Place
- 11079 Woodmont Way
- 1413 Greenoaks Dr
- 11662 Taylor Mill Rd Unit LOT 12 LAKEVIEW
- 11662 Taylor Mill Rd Unit LOT 10 LAKEVIEW
- 11662 Taylor Mill Rd Unit LOT 9
- 11108 Woodmont Way
- 11050 Pinebrook Place
- 11568 Taylor Mill Unit LOT 8
- 11561 Allaire Ct
- 1980 Freedom Trail
- 0 Allaire Ct
- 1993 Freedom Trail
- 1989 Freedom Trail
- 1989 Freedom Trail Unit 178
- 1990 Freedom Trail
- 1985 Freedom Trail
- 11557 Allaire Ct
- 1976 Freedom Trail
- 11560 Allaire Ct
- 1981 Freedom Trail
- 1972 Freedom Trail
- 1972 Freedom Trail Unit 166
- 1977 Freedom Trail
- 1977 Freedom Trail Unit 158
- 11552 Allaire Ct
- 1994 Freedom Trail
- 1968 Freedom Trail
- 1973 Freedom Trail
Your Personal Tour Guide
Ask me questions while you tour the home.