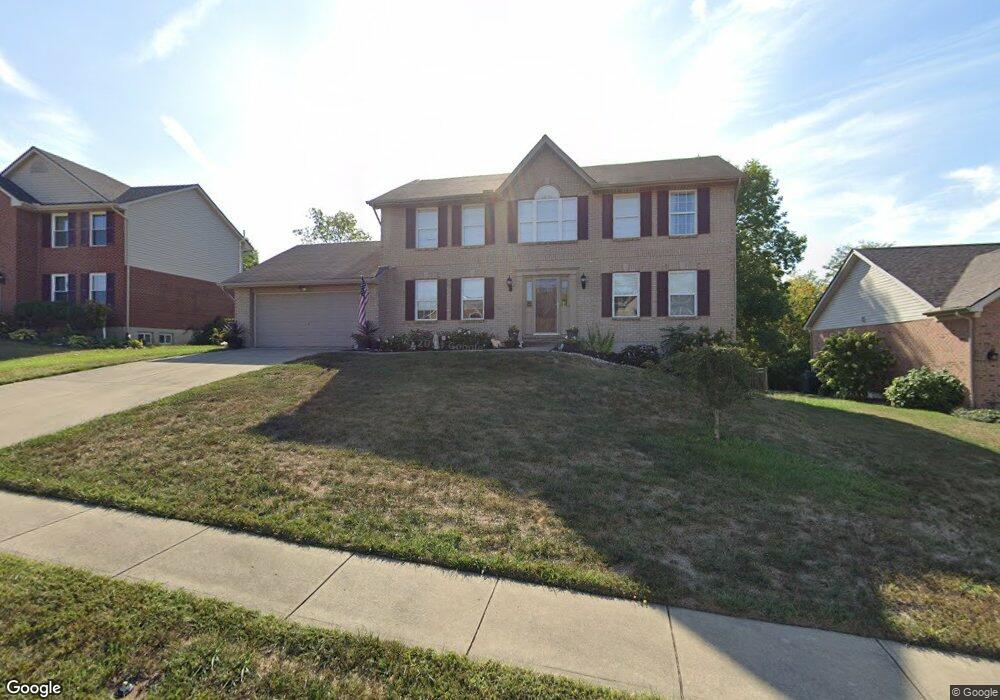
11566 Hancock Ct Independence, KY 41051
Estimated Value: $378,000 - $390,000
4
Beds
3
Baths
2,236
Sq Ft
$171/Sq Ft
Est. Value
About This Home
This home is located at 11566 Hancock Ct, Independence, KY 41051 and is currently estimated at $381,816, approximately $170 per square foot. 11566 Hancock Ct is a home located in Kenton County with nearby schools including Kenton Elementary School, Twenhofel Middle School, and Simon Kenton High School.
Ownership History
Date
Name
Owned For
Owner Type
Purchase Details
Closed on
Jun 29, 2018
Sold by
Vorst David M and Vorst Janet E
Bought by
Hoegermeyer Ralph and Hoegermeyer Rosemarie D
Current Estimated Value
Home Financials for this Owner
Home Financials are based on the most recent Mortgage that was taken out on this home.
Original Mortgage
$30,000
Outstanding Balance
$9,940
Interest Rate
4.6%
Mortgage Type
New Conventional
Estimated Equity
$371,876
Purchase Details
Closed on
Sep 18, 2003
Sold by
Alan Schmidt Construction Inc
Bought by
Vorst David M and Vorst Janet L E
Home Financials for this Owner
Home Financials are based on the most recent Mortgage that was taken out on this home.
Original Mortgage
$156,850
Interest Rate
6.28%
Mortgage Type
Purchase Money Mortgage
Purchase Details
Closed on
Aug 28, 2002
Sold by
Freedom Park Llc
Bought by
Alan Schmidt Construction Inc
Create a Home Valuation Report for This Property
The Home Valuation Report is an in-depth analysis detailing your home's value as well as a comparison with similar homes in the area
Home Values in the Area
Average Home Value in this Area
Purchase History
| Date | Buyer | Sale Price | Title Company |
|---|---|---|---|
| Hoegermeyer Ralph | $242,000 | None Available | |
| Vorst David M | $196,110 | Chicago Title Insurance Co | |
| Alan Schmidt Construction Inc | $39,000 | -- |
Source: Public Records
Mortgage History
| Date | Status | Borrower | Loan Amount |
|---|---|---|---|
| Open | Hoegermeyer Ralph | $30,000 | |
| Previous Owner | Vorst David M | $156,850 |
Source: Public Records
Tax History Compared to Growth
Tax History
| Year | Tax Paid | Tax Assessment Tax Assessment Total Assessment is a certain percentage of the fair market value that is determined by local assessors to be the total taxable value of land and additions on the property. | Land | Improvement |
|---|---|---|---|---|
| 2024 | $2,965 | $242,000 | $40,000 | $202,000 |
| 2023 | $3,054 | $242,000 | $40,000 | $202,000 |
| 2022 | $3,111 | $242,000 | $40,000 | $202,000 |
| 2021 | $3,157 | $242,000 | $40,000 | $202,000 |
| 2020 | $3,223 | $242,000 | $40,000 | $202,000 |
| 2019 | $3,232 | $242,000 | $40,000 | $202,000 |
| 2018 | $2,647 | $196,100 | $40,000 | $156,100 |
| 2017 | $2,575 | $196,100 | $40,000 | $156,100 |
| 2015 | $2,502 | $196,100 | $40,000 | $156,100 |
| 2014 | $2,467 | $196,100 | $40,000 | $156,100 |
Source: Public Records
Map
Nearby Homes
- 1818 Freedom Trail
- 60 Oby Dr
- 56 Apple Dr
- 11553 Allaire Ct
- 11556 Allaire Ct
- 11936 Cadillac Dr
- 10741 Lakefront Cir
- 11893 Wilson Rd
- 1427 Rosewynne Way
- 1436 Rosewynne Way
- 11923 Wilson Rd
- 11066 Pinebrook Place
- 1447 Thornberry Ct
- 1455 Thornberry Ct
- 11048 Woodmont Way
- WEMBLEY Plan at Stonewater
- SARASOTA Plan at Stonewater
- ASHTON Plan at Stonewater
- SAXON Plan at Stonewater
- ALEXANDER Plan at Stonewater
- 11566 Hancock Ct Unit 84
- 83 Hancock Ct Unit 83
- 88 Hancock Ct
- 11570 Hancock Ct
- 11562 Hancock Ct
- 11574 Hancock Ct
- 11574 Hancock Ct Unit 82
- 11558 Hancock Ct
- 11567 Hancock Ct
- 11567 Hancock Ct Unit 127
- 11571 Hancock Ct
- 11563 Hancock Ct
- 11563 Hancock Ct Unit 126
- 11587 Yorktown Ct
- 11554 Hancock Ct
- 11555 Hancock Ct Unit 94
- 11555 Hancock Ct
- 11591 Yorktown Ct
- 11583 Yorktown Ct
- 1857 Freedom Trail