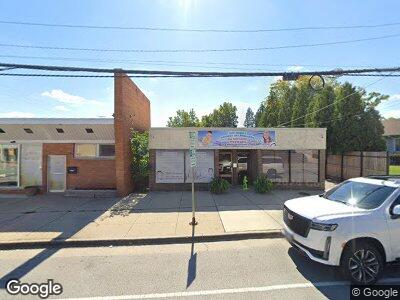
1157 E Algonquin Rd Des Plaines, IL 60016
Estimated Value: $231,633
--
Bed
--
Bath
--
Sq Ft
8,930
Sq Ft Lot
About This Home
This home is located at 1157 E Algonquin Rd, Des Plaines, IL 60016 and is currently estimated at $231,633. 1157 E Algonquin Rd is a home located in Cook County with nearby schools including Forest Elementary School, Algonquin Middle School, and Maine West High School.
Ownership History
Date
Name
Owned For
Owner Type
Purchase Details
Closed on
Sep 10, 2015
Sold by
Sa Reo Fund 900 Llc
Bought by
F & Z Partnership Llc
Current Estimated Value
Home Financials for this Owner
Home Financials are based on the most recent Mortgage that was taken out on this home.
Original Mortgage
$103,250
Interest Rate
4.5%
Mortgage Type
Commercial
Purchase Details
Closed on
Oct 20, 2011
Sold by
Jws Loans Special Assets Llc
Bought by
Sa Reo Fund 900 Llc
Purchase Details
Closed on
Dec 17, 2010
Sold by
Chicago Title Land Trust
Bought by
Jws Loans Special Assets Llc
Purchase Details
Closed on
Aug 13, 2010
Sold by
Chicago Title Land Trust
Bought by
Jws Loans Llc and Mb Financial Bank Na
Purchase Details
Closed on
Jul 5, 1994
Sold by
Chicago Title & Trust Company
Bought by
Suburban Trust & Svgs Bank
Home Financials for this Owner
Home Financials are based on the most recent Mortgage that was taken out on this home.
Original Mortgage
$150,000
Interest Rate
8.61%
Mortgage Type
Commercial
Create a Home Valuation Report for This Property
The Home Valuation Report is an in-depth analysis detailing your home's value as well as a comparison with similar homes in the area
Home Values in the Area
Average Home Value in this Area
Purchase History
| Date | Buyer | Sale Price | Title Company |
|---|---|---|---|
| F & Z Partnership Llc | $147,500 | Chicago Title Insurance Co | |
| Sa Reo Fund 900 Llc | $110,000 | None Available | |
| Jws Loans Special Assets Llc | -- | None Available | |
| Jws Loans Llc | $120,882 | None Available | |
| Suburban Trust & Svgs Bank | $192,000 | -- |
Source: Public Records
Mortgage History
| Date | Status | Borrower | Loan Amount |
|---|---|---|---|
| Closed | F & Z Partnership Llc | $103,250 | |
| Previous Owner | Chicago Title Land Trust Co | $100,000 | |
| Previous Owner | Suburban Trust & Svgs Bank | $150,000 |
Source: Public Records
Tax History Compared to Growth
Tax History
| Year | Tax Paid | Tax Assessment Tax Assessment Total Assessment is a certain percentage of the fair market value that is determined by local assessors to be the total taxable value of land and additions on the property. | Land | Improvement |
|---|---|---|---|---|
| 2024 | $15,532 | $60,361 | $31,234 | $29,127 |
| 2023 | $15,532 | $60,361 | $31,234 | $29,127 |
| 2022 | $15,532 | $60,361 | $31,234 | $29,127 |
| 2021 | $14,688 | $47,785 | $31,234 | $16,551 |
| 2020 | $14,440 | $47,785 | $31,234 | $16,551 |
| 2019 | $12,860 | $47,785 | $31,234 | $16,551 |
| 2018 | $12,206 | $40,815 | $20,079 | $20,736 |
| 2017 | $10,833 | $36,875 | $20,079 | $16,796 |
| 2016 | $10,247 | $36,875 | $20,079 | $16,796 |
| 2015 | $8,492 | $28,089 | $17,848 | $10,241 |
| 2014 | $8,121 | $27,440 | $17,848 | $9,592 |
| 2013 | $7,710 | $26,718 | $17,848 | $8,870 |
Source: Public Records
Map
Nearby Homes
- 1280 Margret St
- 1293 Campbell Ave
- 1030 Graceland Ave
- 1315 Webster Ln
- 974 S 2nd Ave
- 1485 Blaine St
- 1487 Blaine St
- 1489 Blaine St
- 1491 Blaine St
- 1493 Blaine St
- 1114 Girard Ave
- 1074 Bogart St
- 1380 Oakwood Ave Unit 306
- 1394 Carol Ln
- 915 Graceland Ave Unit 1E
- 1405 Ashland Ave Unit 2B
- 900 Center St Unit 2I
- 849 S 2nd Ave
- 1060 E Oakton St
- 1060 E Oakton St
- 1157 E Algonquin Rd
- 1167 E Algonquin Rd
- 1143 E Algonquin Rd
- 1173 E Algonquin Rd
- 1135 E Algonquin Rd
- 1195 Jeannette St
- 1160 Van Buren Ave
- 1168 Van Buren Ave
- Lot E Jeanette Ave
- 1148 Van Buren Ave
- 1125 E Algonquin Rd
- 1183 Jeannette St
- 1140 Van Buren Ave
- 1192 Lee St
- 1262 Lee St
- 1117 E Algonquin Rd
- 1132 Van Buren Ave
- 1173 Jeannette St
- 1124 Van Buren Ave
- 1192 Jeannette St