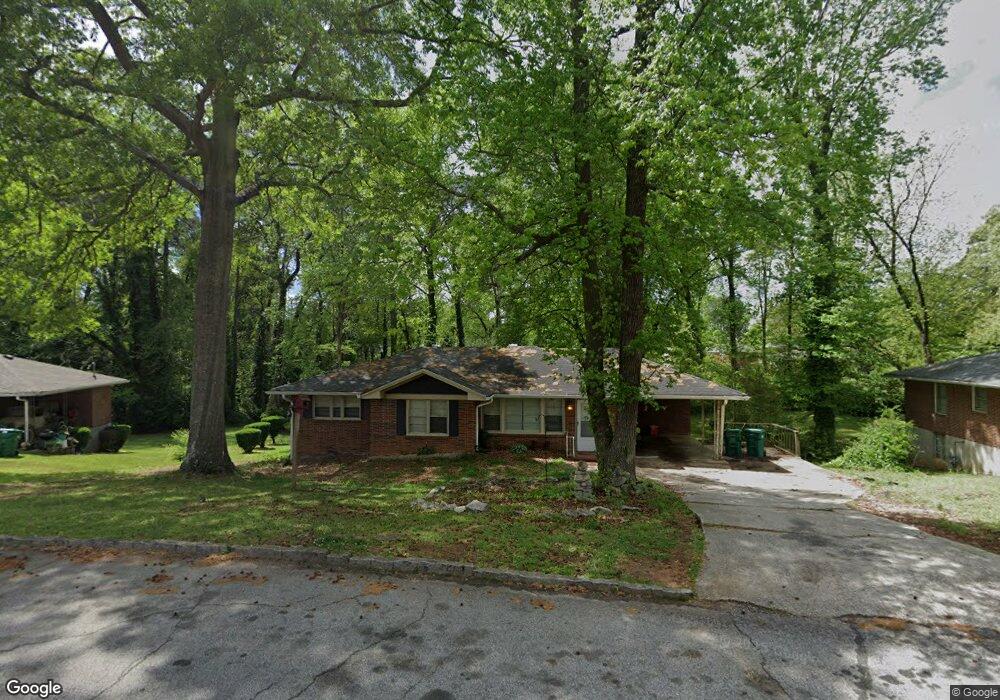
1157 Helen St Unit 2 Morrow, GA 30260
Estimated Value: $207,000 - $237,000
4
Beds
2
Baths
1,365
Sq Ft
$158/Sq Ft
Est. Value
About This Home
This home is located at 1157 Helen St Unit 2, Morrow, GA 30260 and is currently estimated at $215,859, approximately $158 per square foot. 1157 Helen St Unit 2 is a home located in Clayton County with nearby schools including Lake City Elementary School, Babb Middle School, and Forest Park High School.
Ownership History
Date
Name
Owned For
Owner Type
Purchase Details
Closed on
Jul 16, 2020
Sold by
Nguyen Vivian
Bought by
Jean Peniel
Current Estimated Value
Home Financials for this Owner
Home Financials are based on the most recent Mortgage that was taken out on this home.
Original Mortgage
$103,200
Outstanding Balance
$91,511
Interest Rate
3.1%
Mortgage Type
New Conventional
Estimated Equity
$124,348
Purchase Details
Closed on
Nov 23, 2012
Sold by
The Secretary Of Veterans
Bought by
Nguyen Vivian
Purchase Details
Closed on
Jun 7, 2011
Sold by
Us Bk National Assn
Bought by
Veterans Admn
Purchase Details
Closed on
Nov 24, 1998
Sold by
Frreman Jon A
Bought by
Pettiford Emory R
Home Financials for this Owner
Home Financials are based on the most recent Mortgage that was taken out on this home.
Original Mortgage
$83,640
Interest Rate
7.25%
Mortgage Type
VA
Purchase Details
Closed on
Feb 20, 1996
Sold by
Collier Patti T and Jakes Sue T
Bought by
Freeman Jon A
Create a Home Valuation Report for This Property
The Home Valuation Report is an in-depth analysis detailing your home's value as well as a comparison with similar homes in the area
Home Values in the Area
Average Home Value in this Area
Purchase History
| Date | Buyer | Sale Price | Title Company |
|---|---|---|---|
| Jean Peniel | $129,000 | -- | |
| Nguyen Vivian | $37,000 | -- | |
| Veterans Admn | -- | -- | |
| Us Bk National Assn | $47,591 | -- | |
| Pettiford Emory R | $82,500 | -- | |
| Freeman Jon A | $74,900 | -- |
Source: Public Records
Mortgage History
| Date | Status | Borrower | Loan Amount |
|---|---|---|---|
| Open | Jean Peniel | $103,200 | |
| Previous Owner | Pettiford Emory R | $83,640 | |
| Closed | Freeman Jon A | $0 |
Source: Public Records
Tax History Compared to Growth
Tax History
| Year | Tax Paid | Tax Assessment Tax Assessment Total Assessment is a certain percentage of the fair market value that is determined by local assessors to be the total taxable value of land and additions on the property. | Land | Improvement |
|---|---|---|---|---|
| 2024 | $4,245 | $113,120 | $6,400 | $106,720 |
| 2023 | $3,804 | $105,360 | $6,400 | $98,960 |
| 2022 | $3,099 | $78,960 | $6,400 | $72,560 |
| 2021 | $2,038 | $51,600 | $5,200 | $46,400 |
| 2020 | $1,358 | $33,944 | $6,400 | $27,544 |
| 2019 | $1,224 | $30,157 | $4,000 | $26,157 |
| 2018 | $1,185 | $29,180 | $4,000 | $25,180 |
| 2017 | $1,022 | $25,128 | $4,000 | $21,128 |
| 2016 | $654 | $18,336 | $4,000 | $14,336 |
| 2015 | $651 | $0 | $0 | $0 |
| 2014 | $604 | $17,382 | $4,000 | $13,382 |
Source: Public Records
Map
Nearby Homes
- 1167 Sanders Dr
- 1207 Ellington Dr
- 5131 Warner St
- 98 Werner Brook Way SW
- 5474 Ahyoka Dr
- 1341 Kenyon Rd
- 791 Alice St
- 5446 Alder Dr
- 990 Finley Dr
- 753 Glenn Dr
- 5355 Sharon St
- 0 Ash St Unit 10563129
- 718 South Ave
- 5288 Lee Cir
- 4815 Price St
- 4786 Bartlett Rd
- 5570 Ash St
- 944 Forest Ave
- 774 Virginia Cir Unit 2
- 1153 Helen St
- 1161 Helen St
- 1162 Helen St
- 1169 Helen St
- 1154 Helen St
- 1170 Helen St Unit 80
- 1170 Helen St
- 5224 Woodland Dr
- 5240 Woodland Dr
- 1177 Helen St
- 1178 Helen St
- 5248 Woodland Dr
- 1144 Helen St
- 5256 Sanders Rd
- 5187 Jones Ct
- 1185 Helen St
- 5198 Woodland Dr
- 1186 Helen St
- 5264 Sanders Rd
- 0 Helen St Unit 7322154