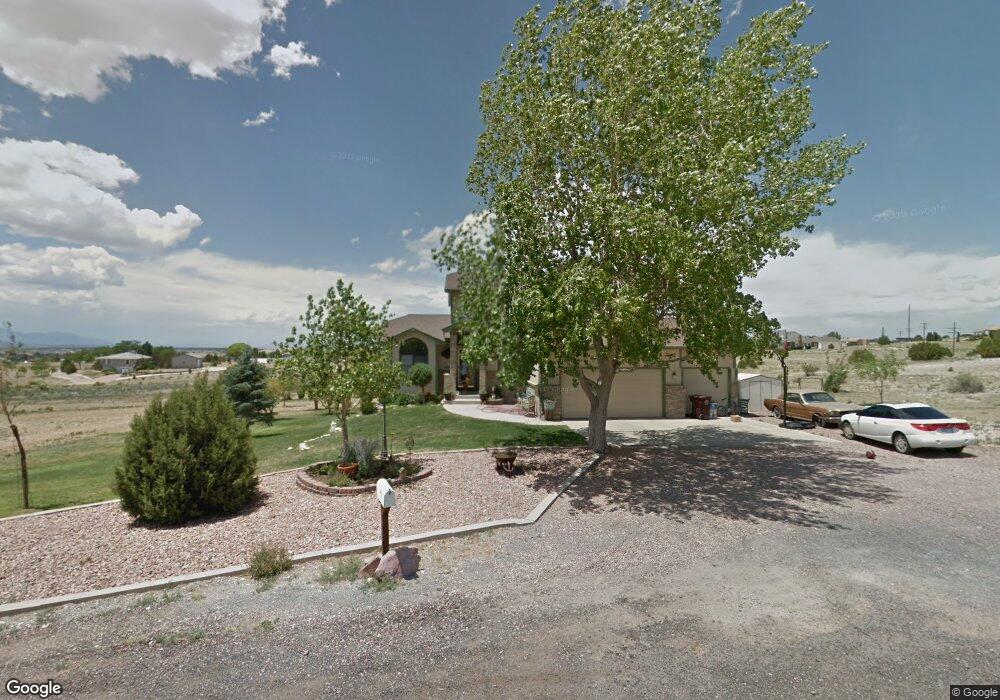
1157 S Shale Ln Pueblo, CO 81007
Estimated Value: $376,000 - $466,000
3
Beds
3
Baths
1,768
Sq Ft
$238/Sq Ft
Est. Value
About This Home
This home is located at 1157 S Shale Ln, Pueblo, CO 81007 and is currently estimated at $419,932, approximately $237 per square foot. 1157 S Shale Ln is a home located in Pueblo County with nearby schools including Desert Sage Elementary School, Liberty Point International School, and Pueblo West High School.
Ownership History
Date
Name
Owned For
Owner Type
Purchase Details
Closed on
Apr 11, 1995
Sold by
Top Construction Inc
Bought by
Ortiz Raymond A + Michelle L
Current Estimated Value
Purchase Details
Closed on
Dec 31, 1994
Sold by
Top Construction Inc
Bought by
Jargowsky Jack R
Purchase Details
Closed on
Aug 23, 1994
Sold by
Ortiz Raymond + Michielle
Bought by
Top Construction Inc
Purchase Details
Closed on
Aug 17, 1994
Sold by
Same
Bought by
Ortiz Raymond + Michielle
Purchase Details
Closed on
Jan 11, 1991
Sold by
Proal Homes Inc
Bought by
Same
Purchase Details
Closed on
Oct 30, 1990
Sold by
Mckinsey Mike
Bought by
Proal Homes Inc
Purchase Details
Closed on
Jun 22, 1990
Sold by
Cooper Kenneth J
Bought by
Mckinsey Mike
Purchase Details
Closed on
Apr 13, 1988
Sold by
Ahrens David R
Bought by
Cooper Kenneth J
Purchase Details
Closed on
Aug 1, 1983
Sold by
Nt
Bought by
Ahrens David R
Purchase Details
Closed on
Nov 15, 1982
Sold by
Lawyers Title Of Pueblo Tr
Bought by
Nt
Create a Home Valuation Report for This Property
The Home Valuation Report is an in-depth analysis detailing your home's value as well as a comparison with similar homes in the area
Home Values in the Area
Average Home Value in this Area
Purchase History
| Date | Buyer | Sale Price | Title Company |
|---|---|---|---|
| Ortiz Raymond A + Michelle L | $146,500 | -- | |
| Top Construction Inc | -- | -- | |
| Jargowsky Jack R | -- | -- | |
| Top Construction Inc | -- | -- | |
| Ortiz Raymond + Michielle | $12,800 | -- | |
| Same | -- | -- | |
| Proal Homes Inc | $16,000 | -- | |
| Mckinsey Mike | -- | -- | |
| Cooper Kenneth J | -- | -- | |
| Ahrens David R | -- | -- | |
| Nt | -- | -- |
Source: Public Records
Tax History Compared to Growth
Tax History
| Year | Tax Paid | Tax Assessment Tax Assessment Total Assessment is a certain percentage of the fair market value that is determined by local assessors to be the total taxable value of land and additions on the property. | Land | Improvement |
|---|---|---|---|---|
| 2024 | $1,655 | $16,480 | -- | -- |
| 2023 | $1,675 | $20,170 | $5,160 | $15,010 |
| 2022 | $1,500 | $14,945 | $3,820 | $11,125 |
| 2021 | $1,538 | $15,380 | $3,930 | $11,450 |
| 2020 | $1,783 | $15,380 | $3,930 | $11,450 |
| 2019 | $1,778 | $17,792 | $2,288 | $15,504 |
| 2018 | $1,640 | $16,405 | $2,304 | $14,101 |
| 2017 | $1,642 | $16,405 | $2,304 | $14,101 |
| 2016 | $1,580 | $15,809 | $2,866 | $12,943 |
| 2015 | $1,567 | $15,809 | $2,866 | $12,943 |
| 2014 | $1,563 | $15,757 | $2,866 | $12,891 |
Source: Public Records
Map
Nearby Homes
- 181 W Linden Ave
- 217 W Linden Ave
- 1155 S Greenway Ave
- 994 S Alexis Ln
- 987 S Blue Hills Dr
- 321 W Linden Ave
- 946 S Greenway Ave
- 1164 S Oakleaf Dr
- 324 W Scarsboro Dr
- 228 W Kyle Dr
- 914 S Greenway Ave
- 893 S Greenway Ave
- 000 S Greenway Ave
- 1086 S Briarcliff Dr
- 919 S Elgin Ct
- 265 W Delray Dr
- 921 S Cellini Ln
- 992 S Saki Dr
- 817 S Aguilar Ln
- 1171 S Shale Ln
- 1170 S Shale Ln
- 1185 S Shale Ln
- 138 W Linden Ave
- 168 W Linden Ave Unit 1
- 386 W Linden Ave Unit 1
- 130 W Linden Ave Unit 3
- 81 W Linden Ave Unit 18
- 81 W Linden Ave
- 193 W Linden Ave
- 1210 S Greenway Ave
- 144 W Linden Ave Unit 1
- 144 W Linden Ave
- 175 W Linden Ave Unit 8
- 1087 S Lion Dr Unit 7
- 1154 S Greenway Ave
- 0 Tbd Greenway Ave Unit 197446
- 0 Tbd Greenway Ave Unit 193273
- 122 W Linden Ave
- 122 W Linden Ave Unit 4