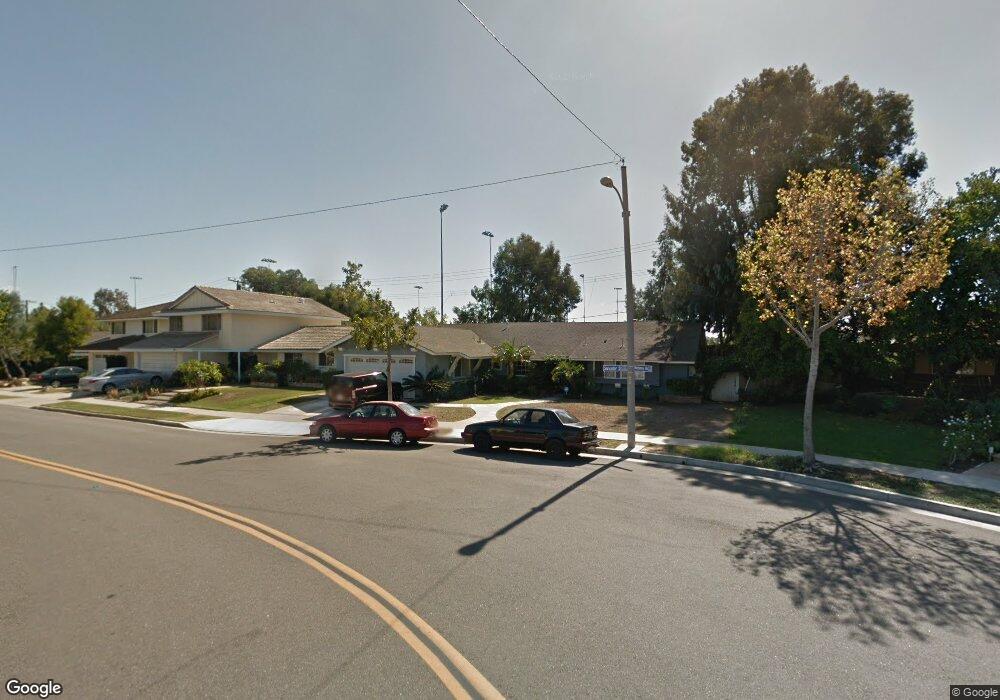
1157 Salvador St Costa Mesa, CA 92626
Estimated Value: $1,446,986 - $1,682,000
4
Beds
2
Baths
1,720
Sq Ft
$911/Sq Ft
Est. Value
About This Home
This home is located at 1157 Salvador St, Costa Mesa, CA 92626 and is currently estimated at $1,567,747, approximately $911 per square foot. 1157 Salvador St is a home located in Orange County with nearby schools including Sonora Elementary School, Costa Mesa High School, and Montessori Christian School.
Ownership History
Date
Name
Owned For
Owner Type
Purchase Details
Closed on
Oct 15, 2018
Sold by
Bull John and Bull Lorraine
Bought by
Bull John C and Bull Lorraine L
Current Estimated Value
Purchase Details
Closed on
Aug 9, 1994
Sold by
Barmore Gary E
Bought by
Bull John and Bull Lorraine
Home Financials for this Owner
Home Financials are based on the most recent Mortgage that was taken out on this home.
Original Mortgage
$195,700
Interest Rate
8.58%
Purchase Details
Closed on
Dec 15, 1993
Sold by
Barmore Martha Ann
Bought by
Barmore Gary E
Home Financials for this Owner
Home Financials are based on the most recent Mortgage that was taken out on this home.
Original Mortgage
$176,000
Interest Rate
7.09%
Create a Home Valuation Report for This Property
The Home Valuation Report is an in-depth analysis detailing your home's value as well as a comparison with similar homes in the area
Home Values in the Area
Average Home Value in this Area
Purchase History
| Date | Buyer | Sale Price | Title Company |
|---|---|---|---|
| Bull John C | -- | None Available | |
| Bull John | $223,000 | Chicago Title Company | |
| Barmore Gary E | -- | Guardian Title Company |
Source: Public Records
Mortgage History
| Date | Status | Borrower | Loan Amount |
|---|---|---|---|
| Previous Owner | Bull John | $195,700 | |
| Previous Owner | Barmore Gary E | $176,000 |
Source: Public Records
Tax History Compared to Growth
Tax History
| Year | Tax Paid | Tax Assessment Tax Assessment Total Assessment is a certain percentage of the fair market value that is determined by local assessors to be the total taxable value of land and additions on the property. | Land | Improvement |
|---|---|---|---|---|
| 2025 | $4,801 | $374,562 | $254,763 | $119,799 |
| 2024 | $4,801 | $367,218 | $249,768 | $117,450 |
| 2023 | $4,619 | $360,018 | $244,870 | $115,148 |
| 2022 | $4,430 | $352,959 | $240,068 | $112,891 |
| 2021 | $4,280 | $346,039 | $235,361 | $110,678 |
| 2020 | $4,224 | $342,491 | $232,947 | $109,544 |
| 2019 | $4,132 | $335,776 | $228,379 | $107,397 |
| 2018 | $4,049 | $329,193 | $223,901 | $105,292 |
| 2017 | $3,982 | $322,739 | $219,511 | $103,228 |
| 2016 | $3,900 | $316,411 | $215,207 | $101,204 |
| 2015 | $3,861 | $311,659 | $211,975 | $99,684 |
| 2014 | $3,775 | $305,555 | $207,823 | $97,732 |
Source: Public Records
Map
Nearby Homes
- 1202 Hazel Place
- 2865 Mendoza Dr
- 1034 El Camino Dr
- 1030 Palmetto Way
- 1016 Valencia St
- 1010 Valencia St
- 994 Valencia St
- 2750 San Carlos Ln
- 3040 Fillmore Way
- 3050 Madison Ave
- 945 Brilliance Ln
- 2817 Portola Dr
- 403 Aura Dr
- 3149 Sharon Ln
- 2520 Andover Place
- 419 Aura Dr
- 117 Clearbrook Ln
- 101 Clearbrook Ln
- 2901 Royal Palm Dr
- 1387 Garlingford St
- 1151 Salvador St
- 1163 Salvador St
- 1145 Salvador St
- 2822 Monterey Ave
- 2815 Monterey Ave
- 1146 Corona Ln
- 1139 Salvador St
- 2821 Monterey Ave
- 2828 Monterey Ave
- 1144 Corona Ln
- 2827 Monterey Ave
- 1133 Salvador St
- 2834 Monterey Ave
- 1132 Salvador St
- 2833 Monterey Ave
- 1127 Salvador St
- 2840 Monterey Ave
- 1133 Corona Ln
- 1126 Salvador St
- 2839 Monterey Ave