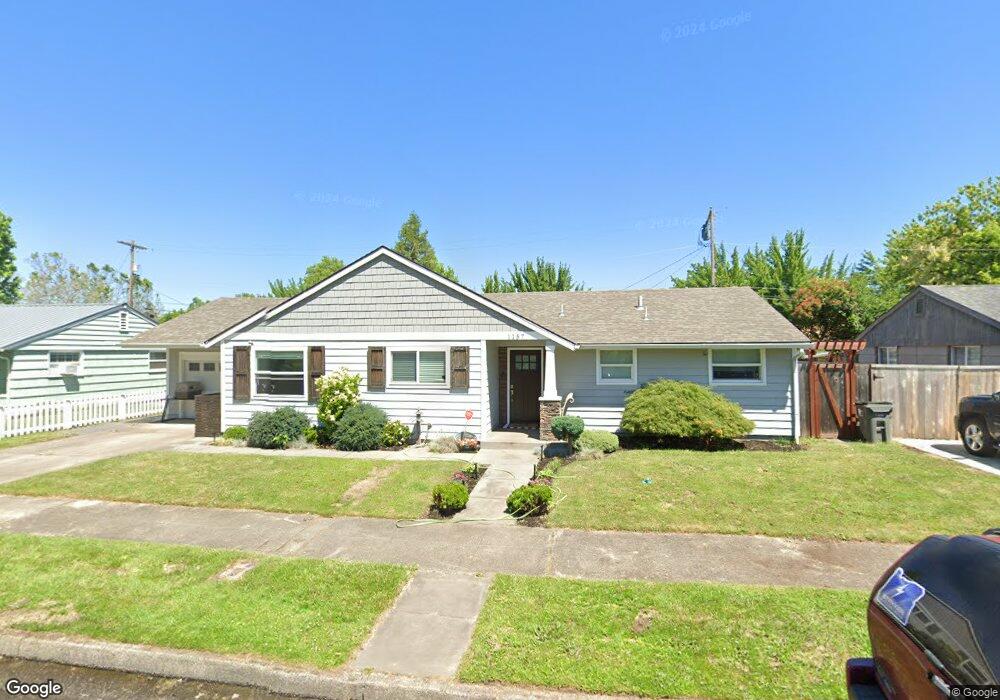
1157 W 18th Place Eugene, OR 97402
Friendly NeighborhoodEstimated Value: $493,000 - $524,054
3
Beds
1
Bath
2,197
Sq Ft
$233/Sq Ft
Est. Value
About This Home
This home is located at 1157 W 18th Place, Eugene, OR 97402 and is currently estimated at $512,264, approximately $233 per square foot. 1157 W 18th Place is a home located in Lane County with nearby schools including Adams Elementary School, Arts And Technology Academy At Jefferson, and Churchill High School.
Ownership History
Date
Name
Owned For
Owner Type
Purchase Details
Closed on
Dec 18, 2013
Sold by
Sheffler Allen Duane and Sheffler Jennifer Jean
Bought by
Sheffler Allen D and Sheffler Jennifer J
Current Estimated Value
Home Financials for this Owner
Home Financials are based on the most recent Mortgage that was taken out on this home.
Original Mortgage
$140,000
Outstanding Balance
$103,989
Interest Rate
4.13%
Mortgage Type
New Conventional
Estimated Equity
$408,275
Purchase Details
Closed on
Oct 1, 2008
Sold by
Tate Wayne
Bought by
Daane Allen and Sheffler Jennifer Jean
Home Financials for this Owner
Home Financials are based on the most recent Mortgage that was taken out on this home.
Original Mortgage
$175,000
Interest Rate
4.86%
Mortgage Type
Seller Take Back
Purchase Details
Closed on
Jul 1, 2004
Sold by
Tate Family Lp
Bought by
Tate Wayne
Purchase Details
Closed on
Dec 11, 1998
Sold by
Tate Jean B and Wayne Tate C
Bought by
The Tate Family Ltd Partnership
Create a Home Valuation Report for This Property
The Home Valuation Report is an in-depth analysis detailing your home's value as well as a comparison with similar homes in the area
Home Values in the Area
Average Home Value in this Area
Purchase History
| Date | Buyer | Sale Price | Title Company |
|---|---|---|---|
| Sheffler Allen D | -- | Fidelity National Title | |
| Daane Allen | $175,000 | Accommodation | |
| Tate Wayne | -- | Pioneer Title Co | |
| The Tate Family Ltd Partnership | -- | Western Pioneer Title Co |
Source: Public Records
Mortgage History
| Date | Status | Borrower | Loan Amount |
|---|---|---|---|
| Open | Sheffler Allen D | $140,000 | |
| Previous Owner | Daane Allen | $175,000 |
Source: Public Records
Tax History Compared to Growth
Tax History
| Year | Tax Paid | Tax Assessment Tax Assessment Total Assessment is a certain percentage of the fair market value that is determined by local assessors to be the total taxable value of land and additions on the property. | Land | Improvement |
|---|---|---|---|---|
| 2025 | $5,205 | $267,157 | -- | -- |
| 2024 | $5,140 | $259,376 | -- | -- |
| 2023 | $5,140 | $251,822 | $0 | $0 |
| 2022 | $4,816 | $244,488 | $0 | $0 |
| 2021 | $4,523 | $237,367 | $0 | $0 |
| 2020 | $4,539 | $230,454 | $0 | $0 |
| 2019 | $4,384 | $223,742 | $0 | $0 |
| 2018 | $4,127 | $210,899 | $0 | $0 |
| 2017 | $3,924 | $210,899 | $0 | $0 |
| 2016 | $3,414 | $187,329 | $0 | $0 |
| 2015 | $2,370 | $131,353 | $0 | $0 |
| 2014 | $2,310 | $127,527 | $0 | $0 |
Source: Public Records
Map
Nearby Homes
- 1485 Polk St
- 2235 Polk St
- 1862 Madison St
- 1700 Jefferson St
- 1760 W 17th Ave
- 1130 Polk Alley
- 2346 Monroe St
- 2305 Chambers St
- 2485 Jackson St
- 2130 Grant St
- 412 W 17th Ave
- 1672 Lawrence St
- 1674 Hayes St Unit B
- 1875 W 15th Ave
- 574 W 13th Ave
- 1445 W 11th Ave
- 375 W 17th Ave
- 1324 Washington St
- 518 W 23rd Ave
- 2127 Lawrence St
- 1177 W 18th Place
- 1127 W 18th Place
- 1130 W 18th Ave
- 1140 W 18th Ave
- 1120 W 18th Ave
- 1152 W 18th Place
- 1107 W 18th Place
- 1172 W 18th Place
- 1122 W 18th Place
- 1110 W 18th Ave
- 1815 Tyler St
- 1112 W 18th Place
- 1192 W 18th Place
- 1097 W 18th Place
- 1135 W 19th Ave
- 1090 W 18th Ave
- 1175 W 19th Ave
- 1125 W 19th Ave
- 1092 W 18th Place
- 1105 W 19th Ave