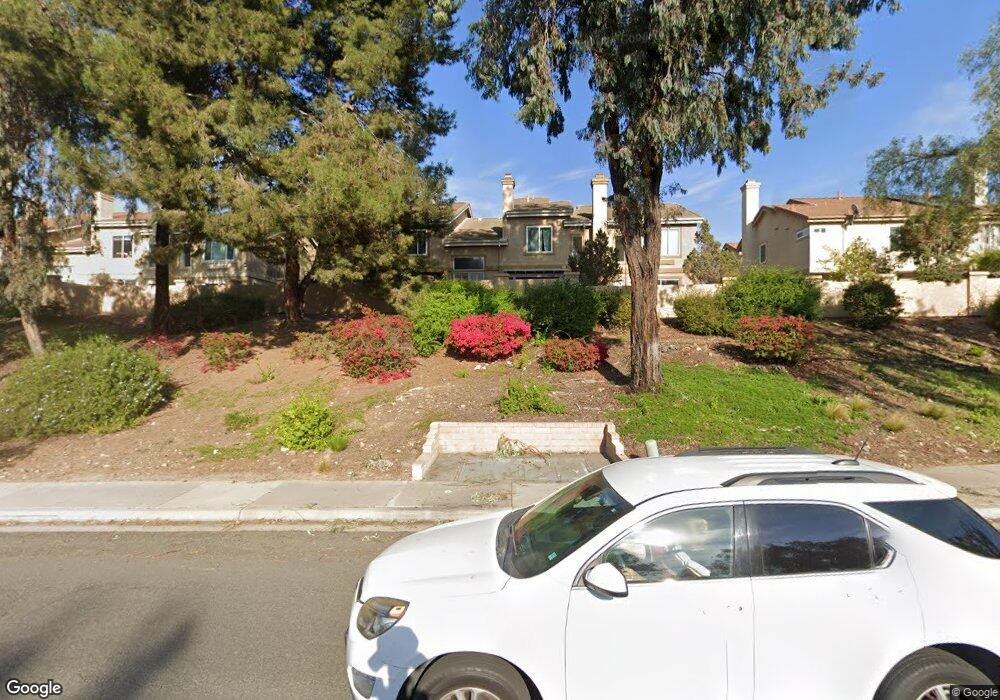
11573 Westview Pkwy San Diego, CA 92126
Mira Mesa NeighborhoodEstimated Value: $889,000 - $1,067,000
3
Beds
3
Baths
1,513
Sq Ft
$634/Sq Ft
Est. Value
About This Home
This home is located at 11573 Westview Pkwy, San Diego, CA 92126 and is currently estimated at $959,723, approximately $634 per square foot. 11573 Westview Pkwy is a home located in San Diego County with nearby schools including Hage Elementary School, Wangenheim Middle School, and Mira Mesa High School.
Ownership History
Date
Name
Owned For
Owner Type
Purchase Details
Closed on
Jan 26, 2015
Sold by
Calbert Blanca
Bought by
Calbert Blanca
Current Estimated Value
Home Financials for this Owner
Home Financials are based on the most recent Mortgage that was taken out on this home.
Original Mortgage
$251,500
Outstanding Balance
$192,559
Interest Rate
3.75%
Mortgage Type
New Conventional
Estimated Equity
$767,164
Purchase Details
Closed on
Dec 17, 2010
Sold by
Calbert Eric
Bought by
Calbert Blanca
Purchase Details
Closed on
Sep 22, 1999
Sold by
Sousa Edilberto F and Sousa Anna L
Bought by
Calbert Eric and Calbert Blanca
Home Financials for this Owner
Home Financials are based on the most recent Mortgage that was taken out on this home.
Original Mortgage
$148,000
Interest Rate
7.37%
Mortgage Type
Purchase Money Mortgage
Purchase Details
Closed on
Jul 28, 1995
Sold by
Pardee Construction Company
Bought by
Sousa Edilberto F and Sousa Anna L
Home Financials for this Owner
Home Financials are based on the most recent Mortgage that was taken out on this home.
Original Mortgage
$149,900
Interest Rate
7.5%
Mortgage Type
Purchase Money Mortgage
Create a Home Valuation Report for This Property
The Home Valuation Report is an in-depth analysis detailing your home's value as well as a comparison with similar homes in the area
Home Values in the Area
Average Home Value in this Area
Purchase History
| Date | Buyer | Sale Price | Title Company |
|---|---|---|---|
| Calbert Blanca | -- | Western Resources Title Co | |
| Calbert Blanca | -- | None Available | |
| Calbert Eric | $211,500 | First American Title | |
| Sousa Edilberto F | $157,000 | Chicago Title Co |
Source: Public Records
Mortgage History
| Date | Status | Borrower | Loan Amount |
|---|---|---|---|
| Open | Calbert Blanca | $251,500 | |
| Closed | Calbert Eric | $148,000 | |
| Previous Owner | Sousa Edilberto F | $149,900 |
Source: Public Records
Tax History Compared to Growth
Tax History
| Year | Tax Paid | Tax Assessment Tax Assessment Total Assessment is a certain percentage of the fair market value that is determined by local assessors to be the total taxable value of land and additions on the property. | Land | Improvement |
|---|---|---|---|---|
| 2025 | $4,015 | $325,039 | $110,869 | $214,170 |
| 2024 | $4,015 | $318,667 | $108,696 | $209,971 |
| 2023 | $3,921 | $312,419 | $106,565 | $205,854 |
| 2022 | $3,809 | $306,294 | $104,476 | $201,818 |
| 2021 | $3,774 | $300,289 | $102,428 | $197,861 |
| 2020 | $3,727 | $297,211 | $101,378 | $195,833 |
| 2019 | $3,655 | $291,385 | $99,391 | $191,994 |
| 2018 | $3,424 | $285,673 | $97,443 | $188,230 |
| 2017 | $3,327 | $280,073 | $95,533 | $184,540 |
| 2016 | $3,274 | $274,582 | $93,660 | $180,922 |
| 2015 | $3,226 | $270,459 | $92,254 | $178,205 |
| 2014 | $3,324 | $265,162 | $90,447 | $174,715 |
Source: Public Records
Map
Nearby Homes
- 9471 Compass Point Dr S
- 11091 Ice Skate Place Unit 20
- 11799 Westview Pkwy
- 11394 Pegasus Ave
- 11279 Pegasus Ave
- 9970 Scripps Vista Way Unit 105
- 9960 Scripps Vista Way Unit 116
- 11482 Cortina Place
- 9310 Galvin Ave Unit 15
- 11325 Affinity Ct Unit 151
- 11365 Affinity Ct Unit 192
- 11940 Black Mountain Rd Unit 41
- 11265 Affinity Ct Unit 103
- 9899 Scripps Westview Way Unit 243
- 9899 Scripps Westview Way Unit 244
- 11215 Affinity Ct Unit 80
- 11235 Affinity Ct Unit 68
- 9368 Babauta Rd Unit 95
- 9368 Babauta Rd Unit 93
- 11175 Affinity Ct Unit 45
- 11575 Westview Pkwy
- 11577 Westview Pkwy Unit 22
- 11569 Westview Pkwy Unit 20
- 11579 Westview Pkwy
- 11567 Westview Pkwy Unit 19
- 11565 Westview Pkwy
- 11561 Westview Pkwy Unit 16
- 11559 Westview Pkwy
- 11553 Westview Pkwy
- 11551 Westview Pkwy Unit 12
- 11547 Westview Pkwy
- 11527 Westview Pkwy
- 11563 Westview Pkwy
- 11505 Westview Pkwy
- 11537 Westview Pkwy Unit 26
- 11545 Westview Pkwy Unit 10
- 11601 Westview Pkwy Unit 1
- 11603 Westview Pkwy
- 11543 Westview Pkwy
- 11539 Westview Pkwy