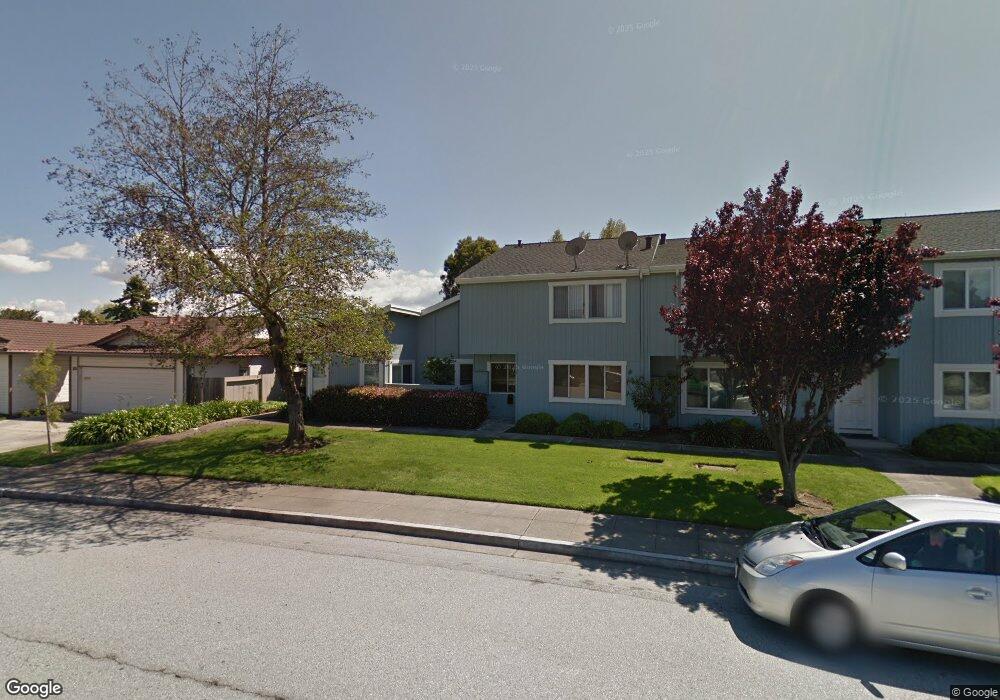
1158 Balclutha Dr Foster City, CA 94404
Treasure Isle NeighborhoodEstimated Value: $1,002,000 - $1,135,000
2
Beds
2
Baths
980
Sq Ft
$1,096/Sq Ft
Est. Value
About This Home
This home is located at 1158 Balclutha Dr, Foster City, CA 94404 and is currently estimated at $1,074,342, approximately $1,096 per square foot. 1158 Balclutha Dr is a home located in San Mateo County with nearby schools including Brewer Island Elementary School, Bowditch Middle School, and San Mateo High School.
Ownership History
Date
Name
Owned For
Owner Type
Purchase Details
Closed on
Feb 12, 2020
Sold by
Vines Henry O and Mcmurray Susan M
Bought by
Hara Henry O and Mcmurray Susan Michelle
Current Estimated Value
Purchase Details
Closed on
Mar 24, 2011
Sold by
Mcmurray Susan M
Bought by
Mcmurray Susan M and Vines Henry O
Home Financials for this Owner
Home Financials are based on the most recent Mortgage that was taken out on this home.
Original Mortgage
$360,000
Outstanding Balance
$249,328
Interest Rate
4.96%
Mortgage Type
New Conventional
Estimated Equity
$825,014
Purchase Details
Closed on
Sep 30, 1998
Sold by
Mcmurray Christine E
Bought by
Mcmurray Susan M
Home Financials for this Owner
Home Financials are based on the most recent Mortgage that was taken out on this home.
Original Mortgage
$212,000
Interest Rate
2.9%
Create a Home Valuation Report for This Property
The Home Valuation Report is an in-depth analysis detailing your home's value as well as a comparison with similar homes in the area
Home Values in the Area
Average Home Value in this Area
Purchase History
| Date | Buyer | Sale Price | Title Company |
|---|---|---|---|
| Hara Henry O | -- | None Available | |
| Mcmurray Susan M | -- | Fidelity National Title Co | |
| Mcmurray Susan M | $265,000 | Commonwealth Land Title Co |
Source: Public Records
Mortgage History
| Date | Status | Borrower | Loan Amount |
|---|---|---|---|
| Open | Mcmurray Susan M | $360,000 | |
| Closed | Mcmurray Susan M | $212,000 |
Source: Public Records
Tax History Compared to Growth
Tax History
| Year | Tax Paid | Tax Assessment Tax Assessment Total Assessment is a certain percentage of the fair market value that is determined by local assessors to be the total taxable value of land and additions on the property. | Land | Improvement |
|---|---|---|---|---|
| 2025 | $1,528 | $97,311 | $41,560 | $55,751 |
| 2023 | $1,528 | $93,535 | $39,948 | $53,587 |
| 2022 | $1,457 | $91,702 | $39,165 | $52,537 |
| 2021 | $1,425 | $89,905 | $38,398 | $51,507 |
| 2020 | $1,389 | $88,984 | $38,005 | $50,979 |
| 2019 | $1,327 | $87,240 | $37,260 | $49,980 |
| 2018 | $1,007 | $85,530 | $36,530 | $49,000 |
| 2017 | $992 | $83,854 | $35,814 | $48,040 |
| 2016 | $1,168 | $82,211 | $35,112 | $47,099 |
| 2015 | $1,138 | $80,977 | $34,585 | $46,392 |
| 2014 | $1,107 | $79,392 | $33,908 | $45,484 |
Source: Public Records
Map
Nearby Homes
- 650 Pilgrim Dr
- 3206 Admiralty Ln
- 1102 Admiralty Ln
- 591 Pilgrim Dr
- 708 Thayer Ln Unit 404
- 769 Eppleton Ln Unit 302
- 1028 Foster Square Ln Unit 305
- 708 Eppleton Ln Unit 204
- 718 Eppleton Ln Unit 303
- 1074 Eagle Ln
- 1336 Marlin Ave
- 926 Lido Ln
- 1018 Lido Ln
- 1351 Marlin Ave
- 224 Loon Ct
- 825 Cortez Ln
- 275 Puffin Ct
- 822 Magellan Ln
- 803 Balboa Ln
- 831 Balboa Ln Unit 10DR
- 1156 Balclutha Dr
- 1154 Balclutha Dr
- 1160 Balclutha Dr
- 1152 Balclutha Dr
- 1150 Balclutha Dr Unit 4
- 728 Nina Ln
- 726 Nina Ln
- 730 Nina Ln
- 1148 Balclutha Dr
- 724 Nina Ln
- 1162 Balclutha Dr
- 722 Nina Ln
- 1146 Balclutha Dr
- 704 Ranger Cir
- 720 Nina Ln
- 718 Nina Ln
- 1155 Balclutha Dr
- 1159 Balclutha Dr
- 716 Ranger Cir
- 716 Nina Ln