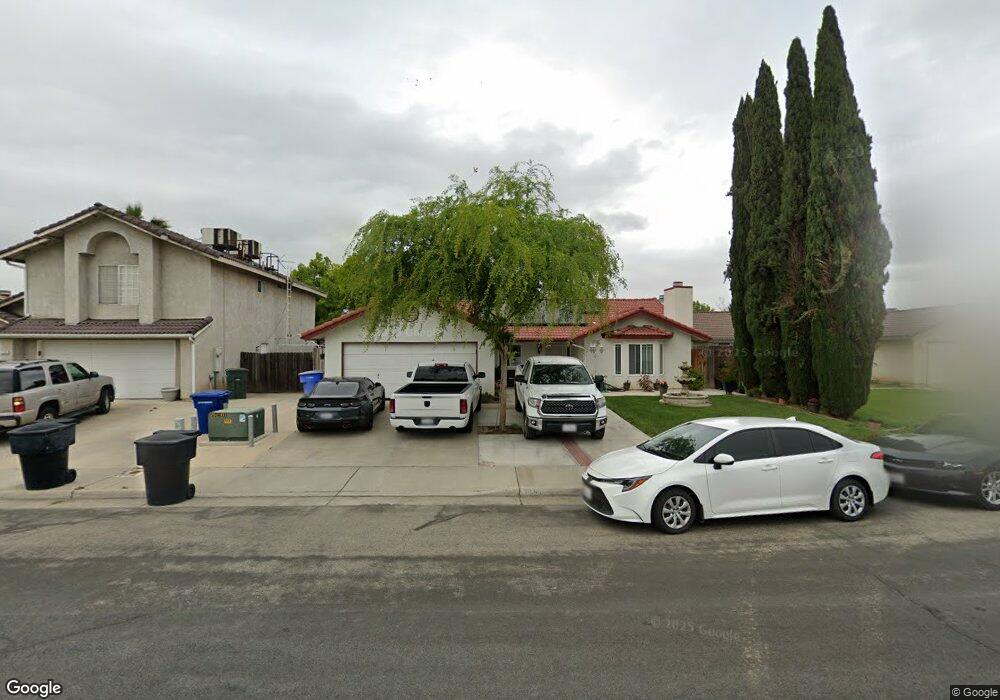
1158 Cypress Ct Hanford, CA 93230
Estimated Value: $331,000 - $348,000
4
Beds
2
Baths
1,544
Sq Ft
$220/Sq Ft
Est. Value
About This Home
This home is located at 1158 Cypress Ct, Hanford, CA 93230 and is currently estimated at $339,088, approximately $219 per square foot. 1158 Cypress Ct is a home located in Kings County with nearby schools including Lee Richmond Elementary School, John F. Kennedy Junior High School, and Hanford High School.
Ownership History
Date
Name
Owned For
Owner Type
Purchase Details
Closed on
Jan 6, 2006
Sold by
Daley Paul A and Daley Vickie L
Bought by
Paul & Vickie Daley Lp
Current Estimated Value
Purchase Details
Closed on
Dec 1, 2003
Sold by
Velazquez Arturo
Bought by
Reyes Ramon and Lopez Piedad
Home Financials for this Owner
Home Financials are based on the most recent Mortgage that was taken out on this home.
Original Mortgage
$123,892
Interest Rate
5.86%
Mortgage Type
Purchase Money Mortgage
Purchase Details
Closed on
Dec 17, 2001
Sold by
Va
Bought by
Velazquez Arturo
Home Financials for this Owner
Home Financials are based on the most recent Mortgage that was taken out on this home.
Original Mortgage
$91,350
Interest Rate
6.39%
Mortgage Type
Seller Take Back
Purchase Details
Closed on
Feb 27, 2001
Sold by
Thompson Michael L and Thompson Teofila L
Bought by
Fleet Mtg Corp
Purchase Details
Closed on
Feb 24, 2001
Sold by
Fleet Mtg Corp
Bought by
Va
Create a Home Valuation Report for This Property
The Home Valuation Report is an in-depth analysis detailing your home's value as well as a comparison with similar homes in the area
Home Values in the Area
Average Home Value in this Area
Purchase History
| Date | Buyer | Sale Price | Title Company |
|---|---|---|---|
| Paul & Vickie Daley Lp | -- | Chicago Title Co | |
| Reyes Ramon | $125,000 | Chicago Title Company | |
| Velazquez Arturo | $101,500 | -- | |
| Fleet Mtg Corp | $82,843 | Chicago Title Co | |
| Va | $82,843 | Chicago Title Co |
Source: Public Records
Mortgage History
| Date | Status | Borrower | Loan Amount |
|---|---|---|---|
| Previous Owner | Reyes Ramon | $123,892 | |
| Previous Owner | Velazquez Arturo | $91,350 |
Source: Public Records
Tax History Compared to Growth
Tax History
| Year | Tax Paid | Tax Assessment Tax Assessment Total Assessment is a certain percentage of the fair market value that is determined by local assessors to be the total taxable value of land and additions on the property. | Land | Improvement |
|---|---|---|---|---|
| 2025 | $1,886 | $177,720 | $49,759 | $127,961 |
| 2023 | $1,886 | $170,821 | $47,828 | $122,993 |
| 2022 | $1,847 | $167,473 | $46,891 | $120,582 |
| 2021 | $1,807 | $164,190 | $45,972 | $118,218 |
| 2020 | $1,826 | $162,507 | $45,501 | $117,006 |
| 2019 | $1,796 | $159,321 | $44,609 | $114,712 |
| 2018 | $1,744 | $156,197 | $43,734 | $112,463 |
| 2017 | $1,718 | $153,134 | $42,876 | $110,258 |
| 2016 | $1,695 | $150,131 | $42,035 | $108,096 |
| 2015 | $1,685 | $147,876 | $41,404 | $106,472 |
| 2014 | $1,652 | $144,979 | $40,593 | $104,386 |
Source: Public Records
Map
Nearby Homes
- 1148 Cypress Ct
- 1170 Cypress Ct
- 1159 Cypress Ct
- 589 Acacia St
- 1149 Cypress Ct
- 566 Acacia St
- 1171 Cypress Ct
- 1167 Poplar Ct
- 1182 Cypress Ct
- 601 Acacia St
- 544 Acacia St
- 1192 Cypress Ct
- 522 Acacia St
- 1179 Poplar Ct
- 1183 Cypress Ct
- 1123 Poplar St
- 500 Acacia St
- 492 Acacia St
- 1158 Hawthorn St
- 1146 Hawthorn St