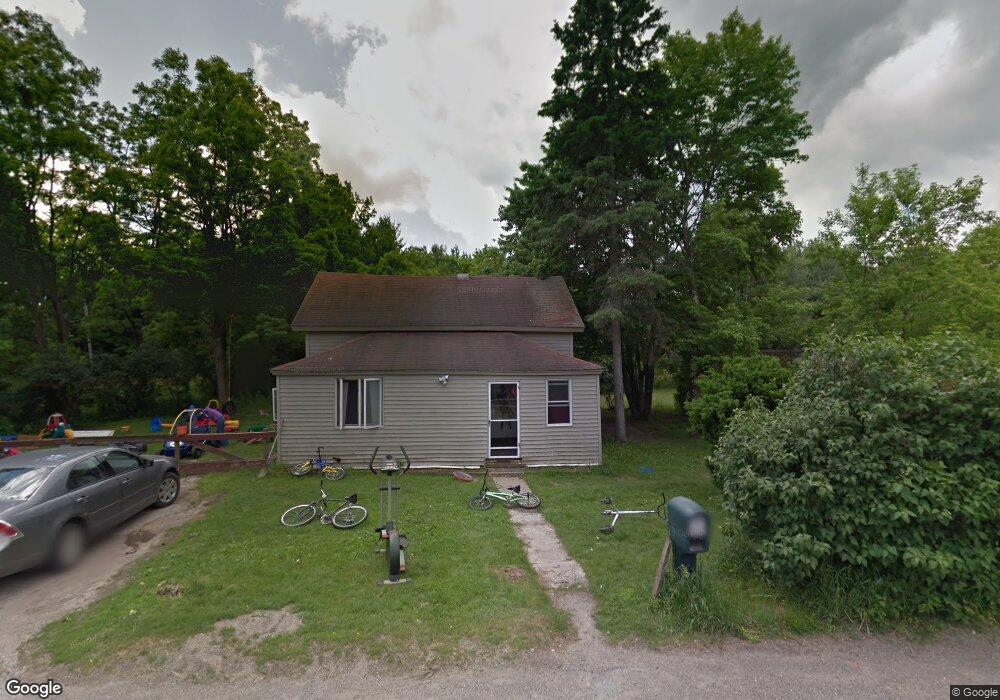
1158 Lamkin St Highgate Center, VT 05459
Estimated Value: $220,497 - $281,000
2
Beds
1
Bath
1,188
Sq Ft
$220/Sq Ft
Est. Value
About This Home
This home is located at 1158 Lamkin St, Highgate Center, VT 05459 and is currently estimated at $261,374, approximately $220 per square foot. 1158 Lamkin St is a home located in Franklin County with nearby schools including Highgate Elementary School and Missisquoi Valley Union Middle/High School.
Ownership History
Date
Name
Owned For
Owner Type
Purchase Details
Closed on
Sep 22, 2024
Sold by
Locke Adam
Bought by
James Locke Way 2 Llc
Current Estimated Value
Purchase Details
Closed on
Jun 11, 2021
Sold by
Locke Adam and Locke Nannette
Purchase Details
Closed on
Jun 14, 2018
Sold by
Locke Adam B
Bought by
Locke Adam B and Locke Nannette J
Purchase Details
Closed on
Aug 21, 2008
Sold by
Locke Bruce L
Bought by
Locke Adam B
Purchase Details
Closed on
Aug 12, 2002
Sold by
Locke Barbara Mae Estate
Bought by
Locke Bruce
Create a Home Valuation Report for This Property
The Home Valuation Report is an in-depth analysis detailing your home's value as well as a comparison with similar homes in the area
Home Values in the Area
Average Home Value in this Area
Purchase History
| Date | Buyer | Sale Price | Title Company |
|---|---|---|---|
| James Locke Way 2 Llc | -- | -- | |
| -- | -- | -- | |
| -- | -- | -- | |
| -- | -- | -- | |
| Locke Adam B | -- | -- | |
| Locke Adam B | -- | -- | |
| Locke Adam B | -- | -- | |
| Locke Adam B | $111,000 | -- | |
| Locke Adam B | $111,000 | -- | |
| Locke Bruce | -- | -- |
Source: Public Records
Tax History Compared to Growth
Tax History
| Year | Tax Paid | Tax Assessment Tax Assessment Total Assessment is a certain percentage of the fair market value that is determined by local assessors to be the total taxable value of land and additions on the property. | Land | Improvement |
|---|---|---|---|---|
| 2024 | $2,447 | $121,500 | $55,000 | $66,500 |
| 2023 | $2,447 | $121,500 | $55,000 | $66,500 |
| 2022 | $2,447 | $121,500 | $55,000 | $66,500 |
| 2021 | $3,517 | $170,800 | $104,300 | $66,500 |
| 2020 | $3,337 | $170,800 | $104,300 | $66,500 |
| 2019 | $3,196 | $170,800 | $104,300 | $66,500 |
| 2018 | $3,055 | $170,800 | $104,300 | $66,500 |
| 2017 | $2,973 | $171,200 | $104,300 | $66,900 |
| 2016 | $2,826 | $171,200 | $104,300 | $66,900 |
Source: Public Records
Map
Nearby Homes