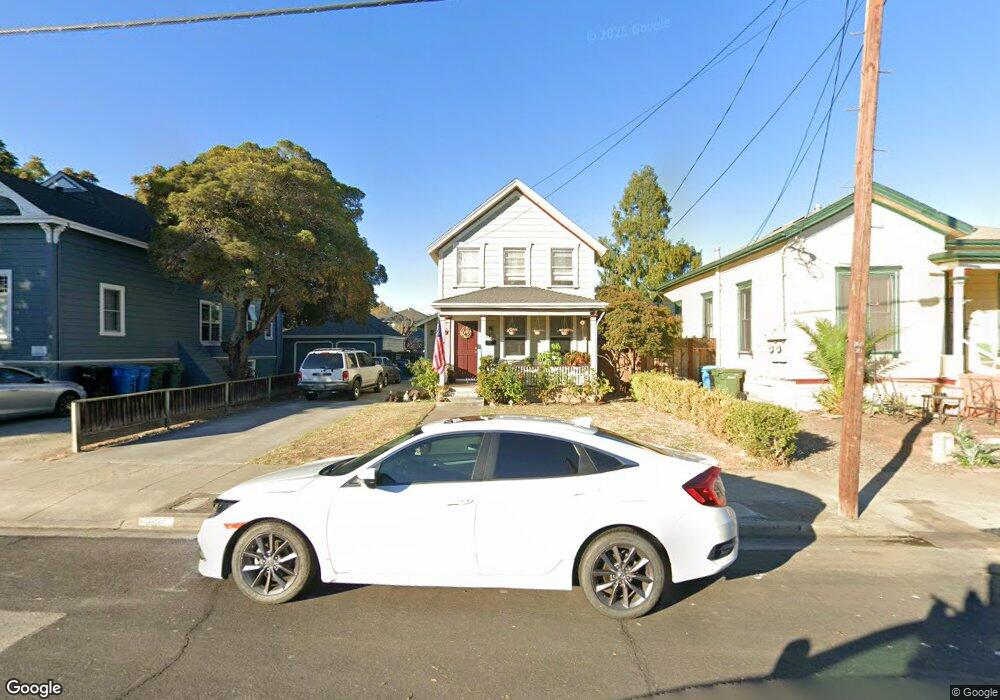
1158 Main St Santa Clara, CA 95050
Downtown Santa Clara NeighborhoodEstimated Value: $1,767,000 - $2,008,000
3
Beds
3
Baths
1,323
Sq Ft
$1,445/Sq Ft
Est. Value
About This Home
This home is located at 1158 Main St, Santa Clara, CA 95050 and is currently estimated at $1,911,710, approximately $1,444 per square foot. 1158 Main St is a home located in Santa Clara County with nearby schools including Westwood Elementary School, Buchser Middle School, and Santa Clara High School.
Ownership History
Date
Name
Owned For
Owner Type
Purchase Details
Closed on
Oct 8, 2015
Sold by
Brady Dianna
Bought by
Brady Dianna
Current Estimated Value
Purchase Details
Closed on
Jun 26, 2012
Sold by
Brady Scott and Brady Dianna V
Bought by
Brady Scott and Brady Dianna
Purchase Details
Closed on
Jun 19, 1997
Sold by
Mccann Steve and Mccann Anna
Bought by
Brady Scott and Brady Dianna
Home Financials for this Owner
Home Financials are based on the most recent Mortgage that was taken out on this home.
Original Mortgage
$287,000
Outstanding Balance
$132,472
Interest Rate
3.82%
Estimated Equity
$1,779,238
Purchase Details
Closed on
Aug 2, 1996
Sold by
Mccann Steven H
Bought by
Mccann Anna M
Home Financials for this Owner
Home Financials are based on the most recent Mortgage that was taken out on this home.
Original Mortgage
$124,000
Interest Rate
4.87%
Create a Home Valuation Report for This Property
The Home Valuation Report is an in-depth analysis detailing your home's value as well as a comparison with similar homes in the area
Home Values in the Area
Average Home Value in this Area
Purchase History
| Date | Buyer | Sale Price | Title Company |
|---|---|---|---|
| Brady Dianna | -- | None Available | |
| Brady Scott | -- | None Available | |
| Brady Scott | $387,000 | Chicago Title Co | |
| Mccann Anna M | -- | Chicago Title Co | |
| Mccann Anna M | $155,000 | Chicago Title Co |
Source: Public Records
Mortgage History
| Date | Status | Borrower | Loan Amount |
|---|---|---|---|
| Open | Brady Scott | $287,000 | |
| Previous Owner | Mccann Anna M | $124,000 |
Source: Public Records
Tax History Compared to Growth
Tax History
| Year | Tax Paid | Tax Assessment Tax Assessment Total Assessment is a certain percentage of the fair market value that is determined by local assessors to be the total taxable value of land and additions on the property. | Land | Improvement |
|---|---|---|---|---|
| 2025 | $7,099 | $617,924 | $239,503 | $378,421 |
| 2024 | $7,099 | $605,808 | $234,807 | $371,001 |
| 2023 | $7,026 | $593,930 | $230,203 | $363,727 |
| 2022 | $6,917 | $582,286 | $225,690 | $356,596 |
| 2021 | $6,887 | $570,869 | $221,265 | $349,604 |
| 2020 | $6,760 | $565,017 | $218,997 | $346,020 |
| 2019 | $6,752 | $553,939 | $214,703 | $339,236 |
| 2018 | $6,319 | $543,079 | $210,494 | $332,585 |
| 2017 | $6,287 | $532,431 | $206,367 | $326,064 |
| 2016 | $6,177 | $521,992 | $202,321 | $319,671 |
| 2015 | $6,151 | $514,152 | $199,282 | $314,870 |
| 2014 | $5,842 | $504,082 | $195,379 | $308,703 |
Source: Public Records
Map
Nearby Homes
- 1239 Harrison St
- 1461 Main St Unit 1
- 1048 Monroe St Unit 218
- 1154 Civic Center Dr
- 820 Civic Center Dr
- 1777 Lafayette St Unit 112
- 1777 Lafayette St Unit 105
- 1549 Pratt Place
- 1015 Warburton Ave
- 645 Jackson St
- 1793 Lafayette St
- 1855 Washington St
- 1922 Main St
- 1935 Jackson St
- 1850 El Camino Real Unit 210
- 2044 Jackson St
- 1690 Civic Center Dr Unit 402
- 1700 Civic Center Dr Unit 616
- 1700 Civic Center Dr Unit 707
- 1700 Civic Center Dr Unit 214