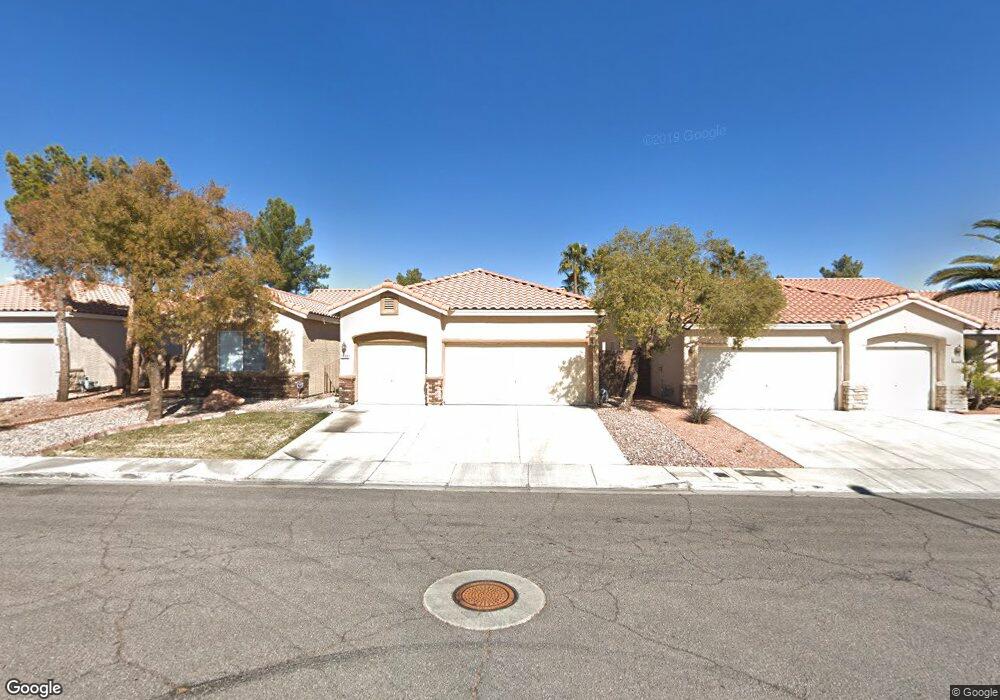
1158 Monogram Way Unit 2 Las Vegas, NV 89123
Silverado Ranch NeighborhoodEstimated Value: $585,965 - $628,000
4
Beds
3
Baths
2,313
Sq Ft
$262/Sq Ft
Est. Value
About This Home
This home is located at 1158 Monogram Way Unit 2, Las Vegas, NV 89123 and is currently estimated at $606,491, approximately $262 per square foot. 1158 Monogram Way Unit 2 is a home located in Clark County with nearby schools including John R Beatty Elementary School, Jack Lund Schofield Middle School, and Silverado High School.
Ownership History
Date
Name
Owned For
Owner Type
Purchase Details
Closed on
Jul 6, 2001
Sold by
Bont Elizabeth
Bought by
Parven Lynda D
Current Estimated Value
Home Financials for this Owner
Home Financials are based on the most recent Mortgage that was taken out on this home.
Original Mortgage
$148,500
Outstanding Balance
$54,954
Interest Rate
6.75%
Estimated Equity
$551,537
Purchase Details
Closed on
May 10, 2000
Sold by
Mcintosh James H
Bought by
Bont Elizabeth
Home Financials for this Owner
Home Financials are based on the most recent Mortgage that was taken out on this home.
Original Mortgage
$180,000
Interest Rate
8.22%
Purchase Details
Closed on
May 20, 1996
Sold by
Bilt Perma
Bought by
Mcintosh James H
Create a Home Valuation Report for This Property
The Home Valuation Report is an in-depth analysis detailing your home's value as well as a comparison with similar homes in the area
Home Values in the Area
Average Home Value in this Area
Purchase History
| Date | Buyer | Sale Price | Title Company |
|---|---|---|---|
| Parven Lynda D | $218,500 | United Title | |
| Bont Elizabeth | $204,000 | Ati Title | |
| Mcintosh James H | $162,500 | Nevada Title Company |
Source: Public Records
Mortgage History
| Date | Status | Borrower | Loan Amount |
|---|---|---|---|
| Open | Parven Lynda D | $148,500 | |
| Previous Owner | Bont Elizabeth | $180,000 |
Source: Public Records
Tax History Compared to Growth
Tax History
| Year | Tax Paid | Tax Assessment Tax Assessment Total Assessment is a certain percentage of the fair market value that is determined by local assessors to be the total taxable value of land and additions on the property. | Land | Improvement |
|---|---|---|---|---|
| 2025 | $2,548 | $141,326 | $38,500 | $102,826 |
| 2024 | $2,474 | $141,326 | $38,500 | $102,826 |
| 2023 | $2,474 | $139,535 | $42,000 | $97,535 |
| 2022 | $2,403 | $125,446 | $35,700 | $89,746 |
| 2021 | $2,333 | $116,605 | $31,150 | $85,455 |
| 2020 | $2,262 | $114,601 | $29,750 | $84,851 |
| 2019 | $2,196 | $111,719 | $28,000 | $83,719 |
| 2018 | $2,132 | $103,819 | $22,750 | $81,069 |
| 2017 | $3,037 | $103,558 | $21,000 | $82,558 |
| 2016 | $2,019 | $98,159 | $15,750 | $82,409 |
| 2015 | $2,015 | $83,573 | $11,550 | $72,023 |
| 2014 | $1,956 | $67,411 | $8,750 | $58,661 |
Source: Public Records
Map
Nearby Homes
- 8644 Emerald Grove Way
- 8777 Shady Peak Way Unit 2
- 1006 Coldwater Falls Way
- 0 S Maryland Pkwy
- 973 Park Walk Ave
- 8880 Star Valley Ct
- 965 Park Walk Ave Unit 5
- 8603 Lakota St
- 1596 Little Crow Ave
- 8959 Coral Shale St
- 8684 Little Fox St
- 8658 Little Fox St
- 927 Clear Diamond Ave
- 949 Single Tree Dr
- 8940 Sandy Slate Way
- 1695 Little Crow Ave
- 861 Clear Diamond Ave
- 8698 Waterford Bend St
- 8634 Waterford Bend St
- 8378 Green Cedar Dr
- 1166 Monogram Way Unit 2
- 1150 Monogram Way
- 8749 Country Crossings St
- 8754 Glennaire Way
- 8735 Country Crossings St Unit none
- 8735 Country Crossings St
- 8735 Country Crossings St Unit n/a
- 1149 Monogram Way
- 8740 Glennaire Way
- 1182 Monogram Way
- 1165 Monogram Way
- 1141 Monogram Way
- 1173 Monogram Way
- 8750 Country Crossings St
- 8765 Glennaire Way
- 1190 Monogram Way
- 1181 Monogram Way
- 8755 Glennaire Way
- 8775 Glennaire Way Unit 2
- 1133 Monogram Way Unit 2