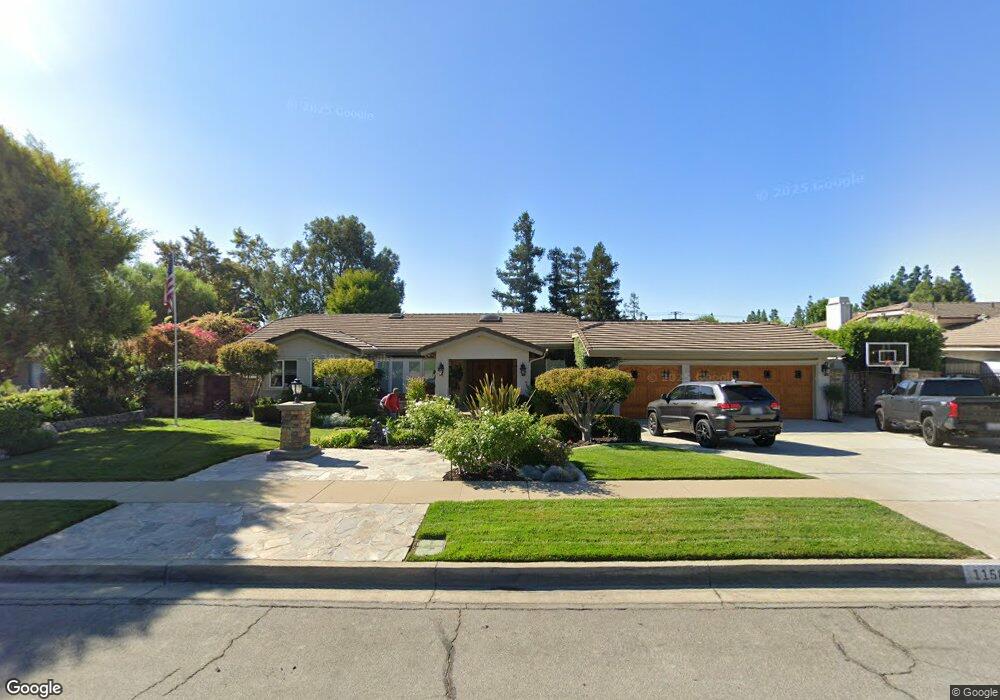
1158 Nicholas St Upland, CA 91784
Estimated Value: $1,103,540 - $1,260,000
4
Beds
3
Baths
2,744
Sq Ft
$425/Sq Ft
Est. Value
About This Home
This home is located at 1158 Nicholas St, Upland, CA 91784 and is currently estimated at $1,165,385, approximately $424 per square foot. 1158 Nicholas St is a home located in San Bernardino County with nearby schools including Valencia Elementary, Pioneer Junior High School, and Upland High School.
Ownership History
Date
Name
Owned For
Owner Type
Purchase Details
Closed on
Nov 10, 2025
Sold by
Johnson Family Revocable Living Trust and Johnson Terrance J
Bought by
Johnson Family Revocable Living Trust and Johnson
Current Estimated Value
Home Financials for this Owner
Home Financials are based on the most recent Mortgage that was taken out on this home.
Original Mortgage
$500,000
Outstanding Balance
$498,594
Interest Rate
6.34%
Mortgage Type
Credit Line Revolving
Estimated Equity
$666,791
Purchase Details
Closed on
May 31, 2018
Sold by
Johnson Terrance J and Johnson Jami Jo
Bought by
Johnson Terrance J and Johnson Jami Jo
Purchase Details
Closed on
Apr 9, 2002
Sold by
Johnson Terrance J and Johnson Jami Jo
Bought by
Johnson Terrance J and Johnson Jami Jo
Home Financials for this Owner
Home Financials are based on the most recent Mortgage that was taken out on this home.
Original Mortgage
$240,000
Interest Rate
7.08%
Purchase Details
Closed on
Mar 20, 2002
Sold by
Johnson Terrance J and Johnson Jami Jo
Bought by
Johnson Terrance J and Johnson Jami Jo
Home Financials for this Owner
Home Financials are based on the most recent Mortgage that was taken out on this home.
Original Mortgage
$240,000
Interest Rate
7.08%
Purchase Details
Closed on
Dec 1, 1995
Sold by
Johnson Terrance Jay and Johnson Jami
Bought by
Johnson Terrance J and Johnson Jami Jo
Create a Home Valuation Report for This Property
The Home Valuation Report is an in-depth analysis detailing your home's value as well as a comparison with similar homes in the area
Home Values in the Area
Average Home Value in this Area
Purchase History
| Date | Buyer | Sale Price | Title Company |
|---|---|---|---|
| Johnson Family Revocable Living Trust | -- | Orange Coast Title Company | |
| Johnson Terrance J | -- | None Available | |
| Johnson Terrance J | -- | None Available | |
| Johnson Terrance J | -- | Landsafe Title | |
| Johnson Terrance J | -- | Landsafe Title | |
| Johnson Terrance J | -- | -- |
Source: Public Records
Mortgage History
| Date | Status | Borrower | Loan Amount |
|---|---|---|---|
| Open | Johnson Family Revocable Living Trust | $500,000 | |
| Previous Owner | Johnson Terrance J | $240,000 |
Source: Public Records
Tax History
| Year | Tax Paid | Tax Assessment Tax Assessment Total Assessment is a certain percentage of the fair market value that is determined by local assessors to be the total taxable value of land and additions on the property. | Land | Improvement |
|---|---|---|---|---|
| 2025 | $6,487 | $585,260 | $172,077 | $413,183 |
| 2024 | $6,281 | $573,784 | $168,703 | $405,081 |
| 2023 | $6,187 | $562,533 | $165,395 | $397,138 |
| 2022 | $6,054 | $551,503 | $162,152 | $389,351 |
| 2021 | $6,048 | $540,690 | $158,973 | $381,717 |
| 2020 | $5,884 | $535,146 | $157,343 | $377,803 |
| 2019 | $5,864 | $524,653 | $154,258 | $370,395 |
| 2018 | $5,646 | $514,365 | $151,233 | $363,132 |
| 2017 | $5,482 | $504,280 | $148,268 | $356,012 |
| 2016 | $5,257 | $494,392 | $145,361 | $349,031 |
| 2015 | $5,136 | $486,966 | $143,178 | $343,788 |
| 2014 | $5,003 | $477,427 | $140,373 | $337,054 |
Source: Public Records
Map
Nearby Homes
- 1140 W 22nd St
- 2193 Lorraine Dr
- 2166 Malati Cir
- 1214 Miller Ct
- 1239 Mallorca St
- 2360 N Mountain Ave
- 2335 N San Antonio Ave
- 2337 N San Antonio Ave
- 907 Pineridge St
- 2415 Park Blvd
- 2257 Poppy Ave
- 1435 Lookout Ct
- 2061 N Albright Ave
- 2326 Fairfield Way
- 680 W Byron Ct
- 959 Kenwood St
- 389 Deborah Ct
- 1063 W 19th St
- 2499 Sierra Dr
- 1904 Belmar Way
- 1142 Nicholas St
- 1176 Nicholas St
- 1157 W 22nd St
- 1141 W 22nd St
- 1175 W 22nd St
- 1159 Nicholas St
- 1126 Nicholas St
- 1143 Nicholas St
- 1177 Nicholas St
- 1190 Nicholas St
- 1125 W 22nd St
- 1191 W 22nd St
- 1127 Nicholas St
- 1189 Nicholas St
- 1110 Nicholas St
- 1154 Emerson St
- 1168 Emerson St
- 1154 W 22nd St
- 1111 W 22nd St
- 1138 Emerson St
Your Personal Tour Guide
Ask me questions while you tour the home.