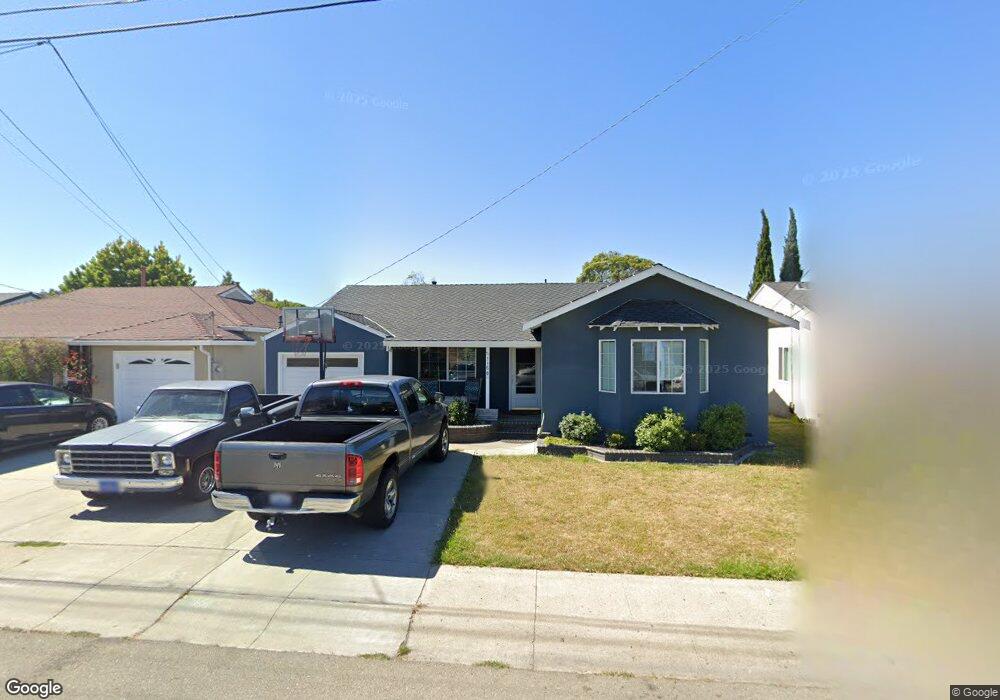
1158 Via Los Trancos San Lorenzo, CA 94580
Estimated Value: $870,000 - $972,770
3
Beds
2
Baths
1,784
Sq Ft
$514/Sq Ft
Est. Value
About This Home
This home is located at 1158 Via Los Trancos, San Lorenzo, CA 94580 and is currently estimated at $916,193, approximately $513 per square foot. 1158 Via Los Trancos is a home located in Alameda County with nearby schools including Del Rey Elementary School, Bohannon Middle School, and Arroyo High School.
Ownership History
Date
Name
Owned For
Owner Type
Purchase Details
Closed on
Jun 14, 2002
Sold by
Greene Lloyd Kevin
Bought by
Greene Lloyd K and Greene Christine M
Current Estimated Value
Home Financials for this Owner
Home Financials are based on the most recent Mortgage that was taken out on this home.
Original Mortgage
$243,750
Interest Rate
6.74%
Purchase Details
Closed on
Oct 4, 2000
Sold by
Greene Lloyd K and Trutna Beverly C
Bought by
Greene Lloyd Kevin
Purchase Details
Closed on
Aug 20, 1997
Sold by
Trutna Alice M
Bought by
Greene Lloyd Kevin and Trutna Beverly C
Home Financials for this Owner
Home Financials are based on the most recent Mortgage that was taken out on this home.
Original Mortgage
$128,000
Interest Rate
7.43%
Create a Home Valuation Report for This Property
The Home Valuation Report is an in-depth analysis detailing your home's value as well as a comparison with similar homes in the area
Home Values in the Area
Average Home Value in this Area
Purchase History
| Date | Buyer | Sale Price | Title Company |
|---|---|---|---|
| Greene Lloyd K | -- | First American Title | |
| Greene Lloyd Kevin | -- | -- | |
| Greene Lloyd Kevin | $160,000 | American Title Co |
Source: Public Records
Mortgage History
| Date | Status | Borrower | Loan Amount |
|---|---|---|---|
| Previous Owner | Greene Lloyd K | $243,750 | |
| Previous Owner | Greene Lloyd Kevin | $128,000 |
Source: Public Records
Tax History Compared to Growth
Tax History
| Year | Tax Paid | Tax Assessment Tax Assessment Total Assessment is a certain percentage of the fair market value that is determined by local assessors to be the total taxable value of land and additions on the property. | Land | Improvement |
|---|---|---|---|---|
| 2025 | $5,061 | $366,520 | $76,640 | $296,880 |
| 2024 | $5,061 | $359,197 | $75,137 | $291,060 |
| 2023 | $5,043 | $359,018 | $73,664 | $285,354 |
| 2022 | $4,961 | $344,979 | $72,220 | $279,759 |
| 2021 | $4,820 | $338,078 | $70,804 | $274,274 |
| 2020 | $4,710 | $341,541 | $70,078 | $271,463 |
| 2019 | $4,708 | $334,846 | $68,704 | $266,142 |
| 2018 | $4,423 | $328,282 | $67,357 | $260,925 |
| 2017 | $4,223 | $321,847 | $66,037 | $255,810 |
| 2016 | $4,026 | $315,537 | $64,742 | $250,795 |
| 2015 | $3,937 | $310,799 | $63,770 | $247,029 |
| 2014 | $3,878 | $304,712 | $62,521 | $242,191 |
Source: Public Records
Map
Nearby Homes
- 18005 Sunol Rd
- 18003 Incline Place
- 18018 Sahara Rd
- 17354 Via el Cerrito
- 1401 Via Coralla
- 819 Bockman Rd
- 18251 Via Jose
- 17316 Via Flores
- 17347 Via Encinas
- 17761 Via Arriba
- 1311 Via Manzanas
- 19150 Hesperian Blvd Unit 19
- 769 Bartlett Ave
- 1608 Keller Ave
- 1867 Via Buena Vista
- 1575 Via Lucas
- 16050 Via Olinda
- 16011 Via Conejo
- 19665 Royal Ave
- 825 W A St Unit 1
- 1152 Via Los Trancos
- 1164 Via Los Trancos
- 1170 Via Los Trancos
- 1173 Via Dolorosa
- 1146 Via Los Trancos
- 1165 Via Dolorosa
- 1181 Via Dolorosa
- 1157 Via Dolorosa
- 1189 Via Dolorosa
- 1176 Via Los Trancos
- 1127 Via Los Trancos
- 1157 Via Los Trancos
- 1163 Via Los Trancos
- 1197 Via Dolorosa
- 1169 Via Los Trancos
- 1180 Via Los Trancos
- 1140 Via Los Trancos
- 1149 Via Dolorosa
- 1175 Via Los Trancos
- 1119 Via Los Trancos