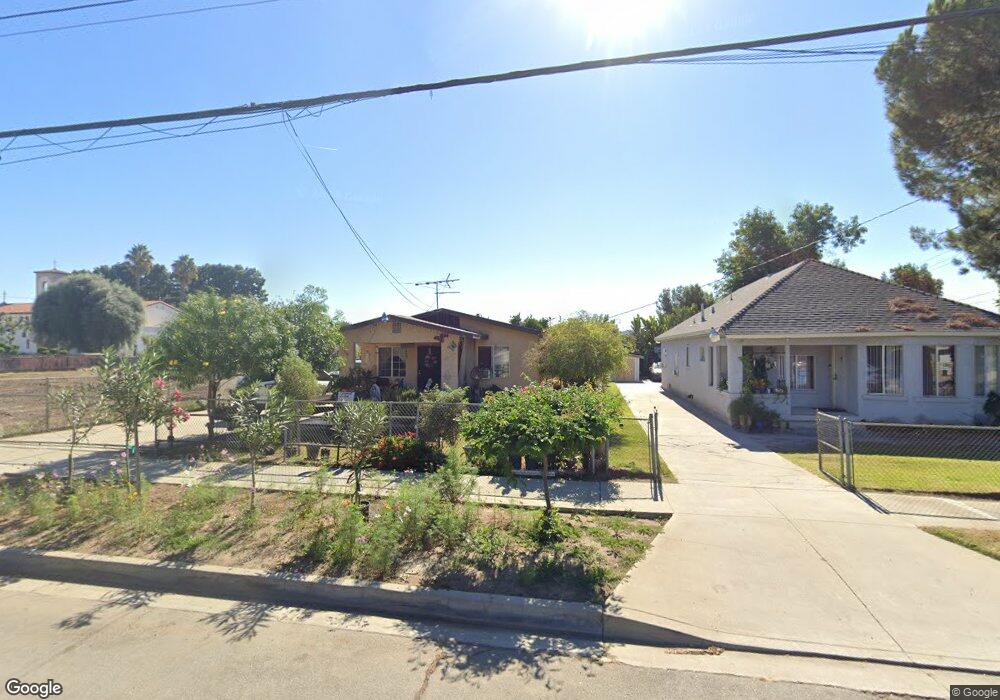
1158 W 11th St Pomona, CA 91766
Ganesha NeighborhoodEstimated Value: $496,640 - $549,000
2
Beds
1
Bath
651
Sq Ft
$809/Sq Ft
Est. Value
About This Home
This home is located at 1158 W 11th St, Pomona, CA 91766 and is currently estimated at $526,660, approximately $809 per square foot. 1158 W 11th St is a home located in Los Angeles County with nearby schools including Vejar Elementary School, Fremont Academy of Engineering and Design, and Garey High School.
Ownership History
Date
Name
Owned For
Owner Type
Purchase Details
Closed on
Dec 6, 2013
Sold by
Jimenez Cesareo J
Bought by
Jimenez Cesareo and Jimenez Beatriz E
Current Estimated Value
Home Financials for this Owner
Home Financials are based on the most recent Mortgage that was taken out on this home.
Original Mortgage
$259,500
Outstanding Balance
$178,736
Interest Rate
2.41%
Mortgage Type
Reverse Mortgage Home Equity Conversion Mortgage
Estimated Equity
$347,924
Purchase Details
Closed on
Nov 1, 2013
Sold by
Jimenez Cesareo J
Bought by
Jimenez Cesareo J and Jimenez Beatriz P
Home Financials for this Owner
Home Financials are based on the most recent Mortgage that was taken out on this home.
Original Mortgage
$259,500
Outstanding Balance
$178,736
Interest Rate
2.41%
Mortgage Type
Reverse Mortgage Home Equity Conversion Mortgage
Estimated Equity
$347,924
Purchase Details
Closed on
Feb 17, 1995
Sold by
Faye Donald H
Bought by
Faye Donald Henry and Faye Elaine Sheldon
Create a Home Valuation Report for This Property
The Home Valuation Report is an in-depth analysis detailing your home's value as well as a comparison with similar homes in the area
Home Values in the Area
Average Home Value in this Area
Purchase History
| Date | Buyer | Sale Price | Title Company |
|---|---|---|---|
| Jimenez Cesareo | -- | None Available | |
| Jimenez Cesareo J | -- | Chicago Title Company | |
| Faye Donald Henry | -- | -- |
Source: Public Records
Mortgage History
| Date | Status | Borrower | Loan Amount |
|---|---|---|---|
| Open | Jimenez Cesareo J | $259,500 |
Source: Public Records
Tax History Compared to Growth
Tax History
| Year | Tax Paid | Tax Assessment Tax Assessment Total Assessment is a certain percentage of the fair market value that is determined by local assessors to be the total taxable value of land and additions on the property. | Land | Improvement |
|---|---|---|---|---|
| 2025 | $1,012 | $58,566 | $41,276 | $17,290 |
| 2024 | $1,012 | $57,418 | $40,467 | $16,951 |
| 2023 | $991 | $56,293 | $39,674 | $16,619 |
| 2022 | $971 | $55,191 | $38,897 | $16,294 |
| 2021 | $945 | $54,110 | $38,135 | $15,975 |
| 2019 | $950 | $52,506 | $37,004 | $15,502 |
| 2018 | $819 | $51,478 | $36,279 | $15,199 |
| 2017 | $804 | $50,469 | $35,568 | $14,901 |
| 2016 | $768 | $49,480 | $34,871 | $14,609 |
| 2015 | $760 | $48,738 | $34,348 | $14,390 |
| 2014 | $763 | $47,785 | $33,676 | $14,109 |
Source: Public Records
Map
Nearby Homes
- 988 W 12th St
- 1261 W Fernleaf Ave
- 934 W 11th St
- 1363 Buena Vista Ave
- 1423 S Hamilton Blvd Unit 1425
- 1425 S White Ave Unit A
- 1456 W 11th St
- 1450 W 11th St
- 1356 S White Ave
- 1300 W Mission Blvd
- 1265 W Mission Blvd
- 1401 W 9th St Unit 56
- 1401 W 9th St Unit 75
- 1060 S Rebecca St
- 1517 W Grand Ave
- 886 S Dudley St Unit F
- 606 W Grand Ave
- 1626 Calatina Dr
- 565 W 9th St
- 1337 Clovis Ct
- 1174 W 11th St
- 1144 W 11th St
- 1190 W 11th St
- 1136 W 11th St
- 1171 W 11th St
- 1196 W 11th St
- 1147 W 11th St
- 1185 W 11th St
- 1135 W 11th St
- 1193 W 11th St
- 1129 W 11th St
- 1105 S Hamilton Blvd
- 1111 S Hamilton Blvd
- 1125 W 11th St
- 1163 W Grand Ave
- 1138 W 10th St
- 1158 W 10th St
- 0 S Myrtle St
- 1170 W 10th St
- 1187 W Grand Ave Unit 3