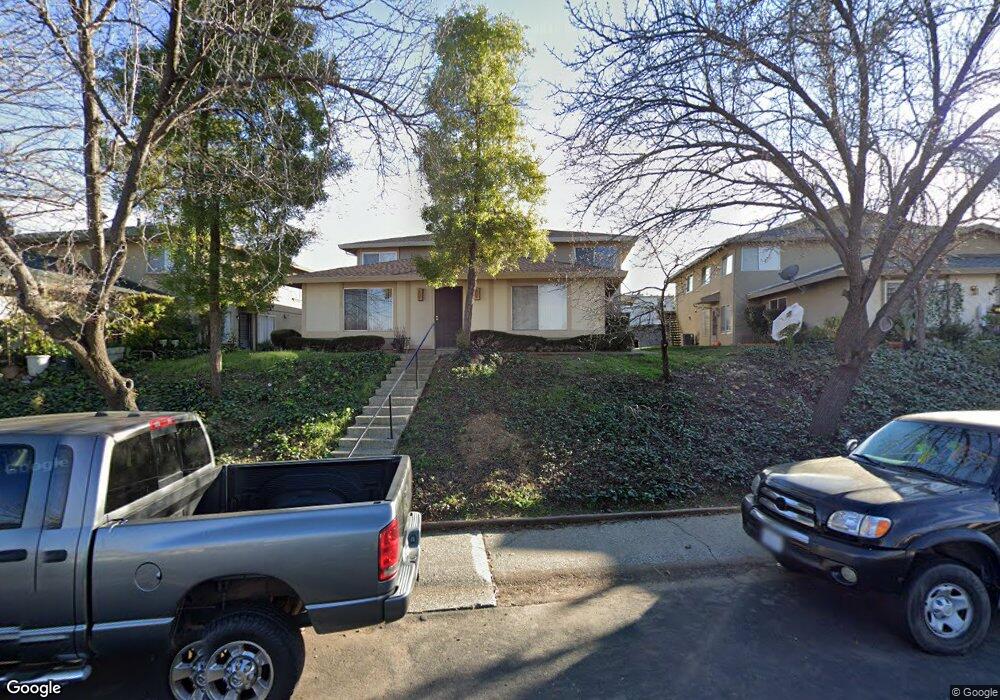
11580 Garnet Way Unit 3 Auburn, CA 95602
Northwest Auburn NeighborhoodEstimated Value: $123,000 - $223,263
2
Beds
1
Bath
966
Sq Ft
$200/Sq Ft
Est. Value
About This Home
This home is located at 11580 Garnet Way Unit 3, Auburn, CA 95602 and is currently estimated at $193,566, approximately $200 per square foot. 11580 Garnet Way Unit 3 is a home located in Placer County with nearby schools including Placer High School, EV Cain Middle, and St. Joseph Catholic School.
Ownership History
Date
Name
Owned For
Owner Type
Purchase Details
Closed on
Aug 28, 2019
Sold by
Ballas Rocky D and Ballas Barbara M
Bought by
Ballas Rocky D and Ballas Barbara M
Current Estimated Value
Purchase Details
Closed on
Sep 21, 2011
Sold by
Fannie Mae
Bought by
Ballas Rocky D and Ballas Barbara M
Home Financials for this Owner
Home Financials are based on the most recent Mortgage that was taken out on this home.
Original Mortgage
$42,750
Outstanding Balance
$29,036
Interest Rate
4.09%
Mortgage Type
New Conventional
Estimated Equity
$164,530
Purchase Details
Closed on
Mar 29, 2004
Sold by
Weiss Jennifer
Bought by
Williams Brandon
Home Financials for this Owner
Home Financials are based on the most recent Mortgage that was taken out on this home.
Original Mortgage
$92,000
Interest Rate
5.57%
Mortgage Type
Purchase Money Mortgage
Create a Home Valuation Report for This Property
The Home Valuation Report is an in-depth analysis detailing your home's value as well as a comparison with similar homes in the area
Home Values in the Area
Average Home Value in this Area
Purchase History
| Date | Buyer | Sale Price | Title Company |
|---|---|---|---|
| Ballas Rocky D | -- | None Available | |
| Ballas Rocky D | $47,500 | Old Republic Title Company | |
| Williams Brandon | $115,000 | Fidelity Title |
Source: Public Records
Mortgage History
| Date | Status | Borrower | Loan Amount |
|---|---|---|---|
| Open | Ballas Rocky D | $42,750 | |
| Previous Owner | Williams Brandon | $92,000 | |
| Closed | Williams Brandon | $17,250 |
Source: Public Records
Tax History Compared to Growth
Tax History
| Year | Tax Paid | Tax Assessment Tax Assessment Total Assessment is a certain percentage of the fair market value that is determined by local assessors to be the total taxable value of land and additions on the property. | Land | Improvement |
|---|---|---|---|---|
| 2025 | $1,622 | $59,652 | $18,837 | $40,815 |
| 2023 | $1,622 | $57,337 | $18,106 | $39,231 |
| 2022 | $1,493 | $56,213 | $17,751 | $38,462 |
| 2021 | $1,471 | $55,111 | $17,403 | $37,708 |
| 2020 | $1,466 | $54,547 | $17,225 | $37,322 |
| 2019 | $1,455 | $53,479 | $16,888 | $36,591 |
| 2018 | $1,424 | $52,431 | $16,557 | $35,874 |
| 2017 | $1,414 | $51,404 | $16,233 | $35,171 |
| 2016 | $1,402 | $50,397 | $15,915 | $34,482 |
| 2015 | $1,389 | $49,641 | $15,676 | $33,965 |
| 2014 | $1,381 | $48,669 | $15,369 | $33,300 |
Source: Public Records
Map
Nearby Homes
- 11670 Garnet Way Unit 4
- 11632 Quartz Dr Unit 4
- 11582 Quartz Dr Unit 3
- 11521 Garnet Way Unit 2
- 11510 Garnet Way Unit 4
- 3277 Professional Dr
- 3677 Galena Dr Unit 3
- 3643 Galena Dr Unit 4
- 3222 Fortune Ct
- 3681 Galena Dr Unit 4
- 3765 Grass Valley Hwy Unit 282
- 3765 Grass Valley Hwy Unit 263
- 3765 Grass Valley Hwy Unit 14
- 3765 Grass Valley Hwy Unit 117
- 3765 Grass Valley Hwy Unit 226
- 0 Bell Rd Unit 225114567
- 11325 Tahoe St
- 12762-Lot 204 Masters Ct
- 2690 Commons Place
- 2660 Commons Place
- 11580 Garnet Way Unit 3
- 11580 Garnet Way Unit 2
- 11580 Garnet Way
- 11580 Garnet Way Unit 4
- 11570 Garnet Way
- 11570 Garnet Way
- 11570 Garnet Way
- 11570 Garnet Way Unit 3
- 11590 Garnet Way Unit 2
- 11590 Garnet Way Unit 4
- 11590 Garnet Way Unit 3
- 11590 Garnet Way
- 11590 Garnet Way Unit 1
- 11590 Garnet Way
- 0 Garnet Way
- 11600 Garnet Way Unit 2
- 11600 Garnet Way Unit 3
- 11600 Garnet Way
- 11600 Garnet Way Unit 1
- 11600 Garnet Way Unit 4