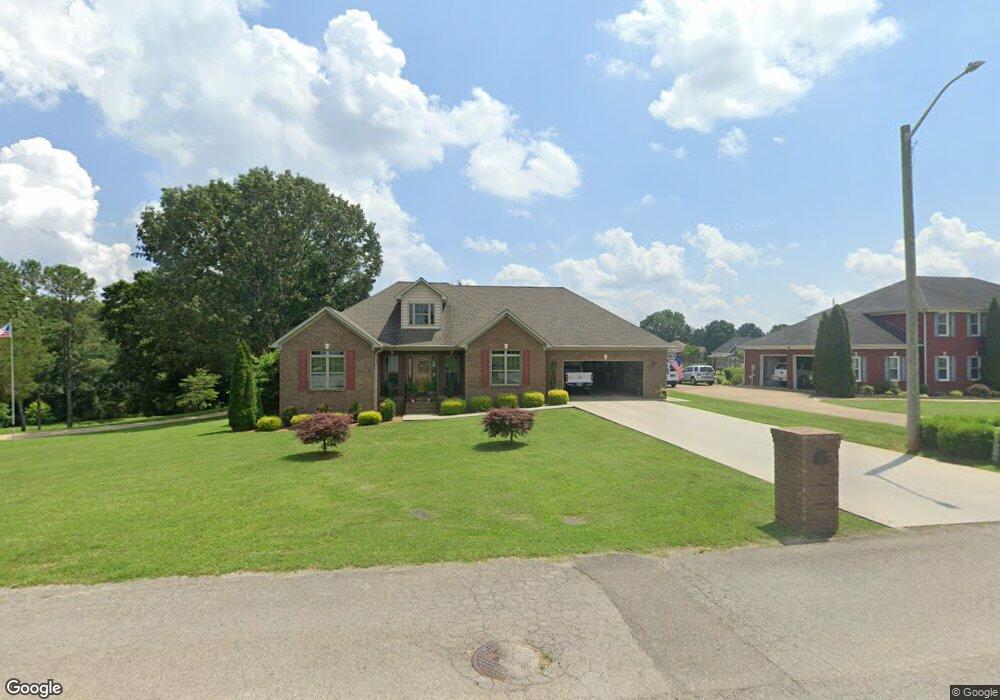
1159 2nd St Lawrenceburg, TN 38464
Estimated Value: $361,818 - $571,000
--
Bed
--
Bath
2,098
Sq Ft
$209/Sq Ft
Est. Value
About This Home
This home is located at 1159 2nd St, Lawrenceburg, TN 38464 and is currently estimated at $438,955, approximately $209 per square foot. 1159 2nd St is a home with nearby schools including Ingram Sowell Elementary School, Lawrenceburg Public Elementary School, and David Crockett Elementary School.
Ownership History
Date
Name
Owned For
Owner Type
Purchase Details
Closed on
Oct 17, 2023
Sold by
Hutton George G and Hutton Judith
Bought by
Hutton Income Only Trust and Fisher
Current Estimated Value
Purchase Details
Closed on
Sep 29, 2014
Sold by
Newton Chris
Bought by
Hutton George G and Hutton Judith
Purchase Details
Closed on
Oct 9, 2013
Sold by
Appleton Randy
Bought by
Newton Chris
Purchase Details
Closed on
Oct 12, 2011
Sold by
Appleton Leigh Anne
Bought by
Appleton Randy
Purchase Details
Closed on
Apr 7, 1989
Bought by
Appleton Randy and Leigh Ann
Create a Home Valuation Report for This Property
The Home Valuation Report is an in-depth analysis detailing your home's value as well as a comparison with similar homes in the area
Home Values in the Area
Average Home Value in this Area
Purchase History
| Date | Buyer | Sale Price | Title Company |
|---|---|---|---|
| Hutton Income Only Trust | -- | None Listed On Document | |
| Hutton George G | $246,276 | -- | |
| Newton Chris | $20,000 | -- | |
| Appleton Randy | -- | -- | |
| Appleton Randy | -- | -- |
Source: Public Records
Tax History Compared to Growth
Tax History
| Year | Tax Paid | Tax Assessment Tax Assessment Total Assessment is a certain percentage of the fair market value that is determined by local assessors to be the total taxable value of land and additions on the property. | Land | Improvement |
|---|---|---|---|---|
| 2025 | $2,543 | $81,825 | $0 | $0 |
| 2024 | $2,543 | $81,825 | $7,500 | $74,325 |
| 2023 | $2,543 | $81,825 | $7,500 | $74,325 |
| 2022 | $2,543 | $81,825 | $7,500 | $74,325 |
| 2021 | $2,578 | $58,650 | $6,250 | $52,400 |
| 2020 | $2,578 | $58,650 | $6,250 | $52,400 |
| 2019 | $2,578 | $58,650 | $6,250 | $52,400 |
| 2018 | $2,578 | $58,650 | $6,250 | $52,400 |
| 2017 | $2,578 | $58,650 | $6,250 | $52,400 |
| 2016 | $2,578 | $58,650 | $6,250 | $52,400 |
| 2015 | $2,441 | $58,650 | $6,250 | $52,400 |
| 2014 | $208 | $5,000 | $5,000 | $0 |
Source: Public Records
Map
Nearby Homes