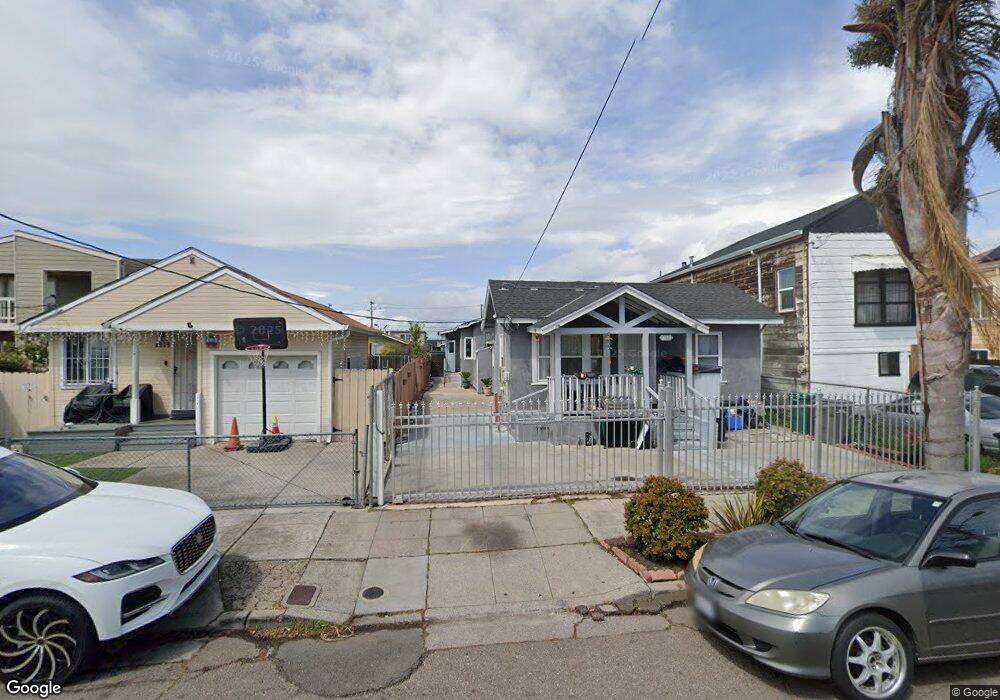
1159 79th Ave Oakland, CA 94621
Fitchburg NeighborhoodEstimated Value: $494,000 - $542,000
2
Beds
1
Bath
860
Sq Ft
$590/Sq Ft
Est. Value
About This Home
This home is located at 1159 79th Ave, Oakland, CA 94621 and is currently estimated at $507,577, approximately $590 per square foot. 1159 79th Ave is a home located in Alameda County with nearby schools including Acorn Woodland Elementary School, Encompass Academy Elementary, and New Highland Academy.
Ownership History
Date
Name
Owned For
Owner Type
Purchase Details
Closed on
Jul 11, 2020
Sold by
Shi Jie
Bought by
Shi Jie and Liang Diane
Current Estimated Value
Purchase Details
Closed on
May 14, 2020
Sold by
Liang Michael Y and Shi Jie
Bought by
Shi Jie and Liang Diane
Purchase Details
Closed on
Mar 23, 2011
Sold by
Deutsche Bank National Trust Company
Bought by
Liang Michael and Shi Jie
Purchase Details
Closed on
Mar 26, 2010
Sold by
Mcconville Nicole
Bought by
Deutsche Bank National Trust Company
Purchase Details
Closed on
Jun 23, 2005
Sold by
Mcconville Nicole
Bought by
Emerald Park House Corp
Purchase Details
Closed on
Feb 9, 2005
Sold by
Emerald Park House Corp
Bought by
Mcconville Nicole
Purchase Details
Closed on
Apr 24, 2002
Sold by
Emerald Park House Corp
Bought by
Grant Eugene
Home Financials for this Owner
Home Financials are based on the most recent Mortgage that was taken out on this home.
Original Mortgage
$180,000
Interest Rate
7.12%
Purchase Details
Closed on
Jan 3, 2002
Sold by
Shk Properties Inc
Bought by
Emerald Park House Corp
Home Financials for this Owner
Home Financials are based on the most recent Mortgage that was taken out on this home.
Original Mortgage
$50,000
Interest Rate
7.01%
Mortgage Type
Seller Take Back
Purchase Details
Closed on
Oct 3, 2000
Sold by
Southall Webster and Southall Angela M
Bought by
Shk Properties Inc
Purchase Details
Closed on
Mar 10, 1994
Sold by
First Alliance Mtg Company
Bought by
Southall Webster and Southall Angela Marie
Home Financials for this Owner
Home Financials are based on the most recent Mortgage that was taken out on this home.
Original Mortgage
$27,000
Interest Rate
7.21%
Mortgage Type
Seller Take Back
Create a Home Valuation Report for This Property
The Home Valuation Report is an in-depth analysis detailing your home's value as well as a comparison with similar homes in the area
Home Values in the Area
Average Home Value in this Area
Purchase History
| Date | Buyer | Sale Price | Title Company |
|---|---|---|---|
| Shi Jie | -- | None Available | |
| Shi Jie | -- | None Available | |
| Shi Jie | -- | None Available | |
| Liang Michael | $61,000 | Chicago Title Company | |
| Deutsche Bank National Trust Company | $340,000 | Accommodation | |
| Emerald Park House Corp | -- | -- | |
| Mcconville Nicole | -- | -- | |
| Grant Eugene | $225,000 | First American Title | |
| Emerald Park House Corp | $120,000 | First American Title | |
| Shk Properties Inc | $78,200 | -- | |
| Southall Webster | $30,000 | Fidelity National Title |
Source: Public Records
Mortgage History
| Date | Status | Borrower | Loan Amount |
|---|---|---|---|
| Previous Owner | Grant Eugene | $180,000 | |
| Previous Owner | Emerald Park House Corp | $50,000 | |
| Previous Owner | Southall Webster | $27,000 | |
| Closed | Southall Webster | $1,800 | |
| Closed | Emerald Park House Corp | $70,000 | |
| Closed | Grant Eugene | $45,000 |
Source: Public Records
Tax History
| Year | Tax Paid | Tax Assessment Tax Assessment Total Assessment is a certain percentage of the fair market value that is determined by local assessors to be the total taxable value of land and additions on the property. | Land | Improvement |
|---|---|---|---|---|
| 2025 | $3,909 | $165,489 | $23,444 | $149,045 |
| 2024 | $3,909 | $163,507 | $22,984 | $146,123 |
| 2023 | $4,073 | $165,792 | $22,534 | $143,258 |
| 2022 | $3,906 | $162,541 | $22,092 | $140,449 |
| 2021 | $3,606 | $159,355 | $21,659 | $137,696 |
| 2020 | $3,565 | $157,722 | $21,437 | $136,285 |
| 2019 | $3,350 | $154,630 | $21,017 | $133,613 |
| 2018 | $3,284 | $151,599 | $20,605 | $130,994 |
| 2017 | $3,129 | $148,627 | $20,201 | $128,426 |
| 2016 | $2,948 | $145,714 | $19,805 | $125,909 |
| 2015 | $2,930 | $143,525 | $19,507 | $124,018 |
| 2014 | $1,762 | $63,751 | $19,125 | $44,626 |
Source: Public Records
Map
Nearby Homes
Your Personal Tour Guide
Ask me questions while you tour the home.