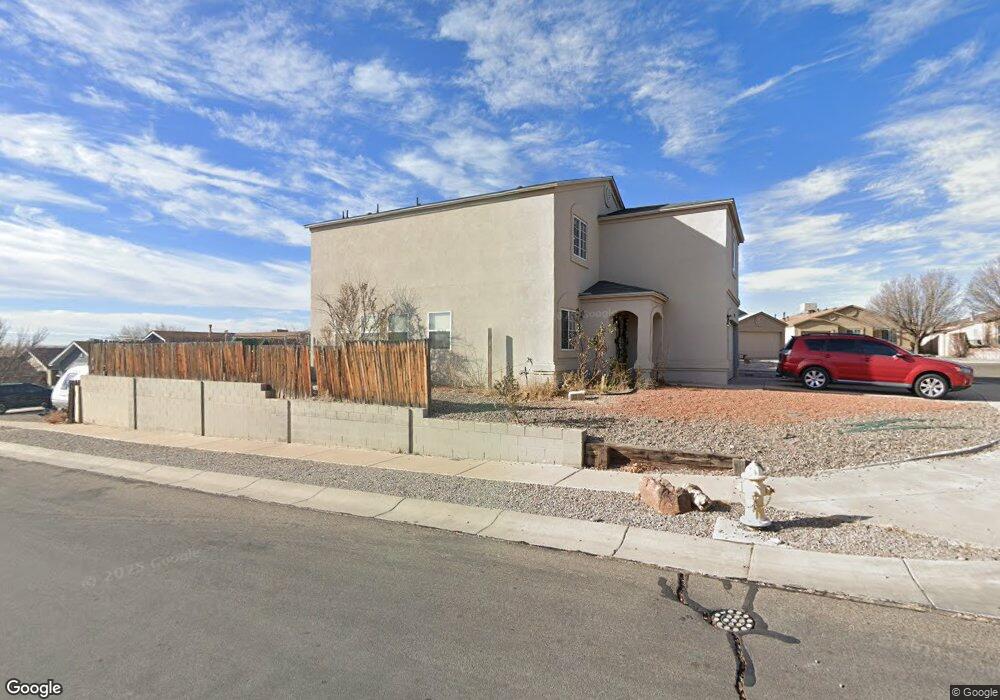
1159 82nd St SW Albuquerque, NM 87121
Southwest Heights NeighborhoodEstimated Value: $288,000 - $324,000
4
Beds
3
Baths
2,130
Sq Ft
$145/Sq Ft
Est. Value
About This Home
This home is located at 1159 82nd St SW, Albuquerque, NM 87121 and is currently estimated at $309,190, approximately $145 per square foot. 1159 82nd St SW is a home located in Bernalillo County with nearby schools including Maryann Binford Elementary School, Truman Middle School, and Atrisco Heritage Academy High School.
Ownership History
Date
Name
Owned For
Owner Type
Purchase Details
Closed on
May 20, 2005
Sold by
Rael Patricia and Rael Jonathan
Bought by
Perkins Albert and Perkins Gwendolyn
Current Estimated Value
Home Financials for this Owner
Home Financials are based on the most recent Mortgage that was taken out on this home.
Original Mortgage
$149,900
Outstanding Balance
$77,806
Interest Rate
5.87%
Mortgage Type
Fannie Mae Freddie Mac
Estimated Equity
$231,384
Purchase Details
Closed on
Nov 4, 2003
Sold by
Vantage Builders Inc
Bought by
Rael Jonathan and Rael Patricia
Home Financials for this Owner
Home Financials are based on the most recent Mortgage that was taken out on this home.
Original Mortgage
$120,350
Interest Rate
9.87%
Mortgage Type
Purchase Money Mortgage
Purchase Details
Closed on
Jun 17, 2003
Sold by
Stv Investments Llc
Bought by
Vantage Builders Inc
Create a Home Valuation Report for This Property
The Home Valuation Report is an in-depth analysis detailing your home's value as well as a comparison with similar homes in the area
Home Values in the Area
Average Home Value in this Area
Purchase History
| Date | Buyer | Sale Price | Title Company |
|---|---|---|---|
| Perkins Albert | -- | Fidelity National Title Co | |
| Rael Jonathan | -- | Rio Rancho Title Inc | |
| Vantage Builders Inc | -- | Rio Rancho Title Inc |
Source: Public Records
Mortgage History
| Date | Status | Borrower | Loan Amount |
|---|---|---|---|
| Open | Perkins Albert | $149,900 | |
| Previous Owner | Rael Jonathan | $120,350 | |
| Closed | Vantage Builders Inc | $0 |
Source: Public Records
Tax History Compared to Growth
Tax History
| Year | Tax Paid | Tax Assessment Tax Assessment Total Assessment is a certain percentage of the fair market value that is determined by local assessors to be the total taxable value of land and additions on the property. | Land | Improvement |
|---|---|---|---|---|
| 2025 | $2,213 | $54,017 | $10,704 | $43,313 |
| 2024 | $2,213 | $52,443 | $10,392 | $42,051 |
| 2023 | $2,176 | $50,917 | $10,090 | $40,827 |
| 2022 | $2,103 | $49,434 | $9,796 | $39,638 |
| 2021 | $2,032 | $47,995 | $9,511 | $38,484 |
| 2020 | $1,999 | $46,597 | $9,234 | $37,363 |
| 2019 | $1,940 | $45,240 | $8,965 | $36,275 |
| 2018 | $1,871 | $45,240 | $8,965 | $36,275 |
| 2017 | $1,814 | $43,922 | $8,704 | $35,218 |
| 2016 | $1,761 | $41,402 | $8,205 | $33,197 |
| 2015 | $40,196 | $40,196 | $7,966 | $32,230 |
| 2014 | $1,721 | $40,529 | $7,966 | $32,563 |
| 2013 | -- | $40,529 | $7,966 | $32,563 |
Source: Public Records
Map
Nearby Homes
- 921 Roma Dora Ln
- 0 Sage Rd SW Unit 1085259
- 0 Nwq Unser and Sage SW Unit 1081546
- 8709 Rhonda Ave SW
- 1815 Shadetree Dr SW
- 1420 Summerfield Place SW
- 1615 Quiet Desert Dr SW
- 7605 Windsong Place SW
- 7814 Desert Canyon Place SW
- 1209 Locura Rd SW
- 8600 Kimela Ct SW
- 0 Sage & 90th St SW Unit 1083191
- 9300 Jenny Ave SW
- 780 Jaconita Place SW
- 7304 Autumn Sky Rd SW
- 7901 Purple Fringe Rd SW
- 704 Nicklaus Dr SW
- 3525 Tower Rd SW
- 0 Nna Unser&tower SW Unit 1081416
- 9504 Sage Ranch Ct
- 1155 82nd St SW
- 1201 82nd St SW
- 1151 82nd St SW
- 8228 Feathertop Rd SW
- 1147 82nd St SW
- 8224 Feathertop Rd SW
- 1205 82nd St SW
- 1200 82nd St SW
- 1143 82nd St SW
- 8223 Feathertop Rd SW
- 1220 Diamond Place SW
- 1136 82nd St SW
- 8220 Feathertop Rd SW
- 1139 82nd St SW
- 8219 Feathertop Rd SW
- 1204 82nd St SW
- 1216 Diamond Place SW
- 1209 82nd St SW
- 1224 Diamond Place SW
- 8215 Feathertop Rd SW