11597 E Crescent St Desert Hot Springs, CA 92240
Estimated Value: $410,607 - $482,000
3
Beds
2
Baths
1,926
Sq Ft
$227/Sq Ft
Est. Value
About This Home
This home is located at 11597 E Crescent St, Desert Hot Springs, CA 92240 and is currently estimated at $437,152, approximately $226 per square foot. 11597 E Crescent St is a home located in Riverside County with nearby schools including Painted Hills Middle School and Desert Hot Springs High School.
Ownership History
Date
Name
Owned For
Owner Type
Purchase Details
Closed on
Aug 20, 2008
Sold by
Western Pacific Housing Inc
Bought by
Aseltine Craig and Aseltine Georgean
Current Estimated Value
Home Financials for this Owner
Home Financials are based on the most recent Mortgage that was taken out on this home.
Original Mortgage
$155,016
Outstanding Balance
$101,441
Interest Rate
6.27%
Mortgage Type
Purchase Money Mortgage
Estimated Equity
$335,711
Create a Home Valuation Report for This Property
The Home Valuation Report is an in-depth analysis detailing your home's value as well as a comparison with similar homes in the area
Home Values in the Area
Average Home Value in this Area
Purchase History
| Date | Buyer | Sale Price | Title Company |
|---|---|---|---|
| Aseltine Craig | $194,000 | First American Title Co Nhs |
Source: Public Records
Mortgage History
| Date | Status | Borrower | Loan Amount |
|---|---|---|---|
| Open | Aseltine Craig | $155,016 |
Source: Public Records
Tax History Compared to Growth
Tax History
| Year | Tax Paid | Tax Assessment Tax Assessment Total Assessment is a certain percentage of the fair market value that is determined by local assessors to be the total taxable value of land and additions on the property. | Land | Improvement |
|---|---|---|---|---|
| 2025 | $5,801 | $249,504 | $62,369 | $187,135 |
| 2023 | $5,801 | $239,818 | $59,949 | $179,869 |
| 2022 | $5,740 | $235,117 | $58,774 | $176,343 |
| 2021 | $5,591 | $230,508 | $57,622 | $172,886 |
| 2020 | $5,434 | $228,146 | $57,032 | $171,114 |
| 2019 | $5,467 | $223,673 | $55,914 | $167,759 |
| 2018 | $5,343 | $219,288 | $54,818 | $164,470 |
| 2017 | $5,265 | $214,990 | $53,744 | $161,246 |
| 2016 | $5,105 | $210,776 | $52,691 | $158,085 |
| 2015 | $4,375 | $199,000 | $50,000 | $149,000 |
| 2014 | $4,104 | $176,000 | $44,000 | $132,000 |
Source: Public Records
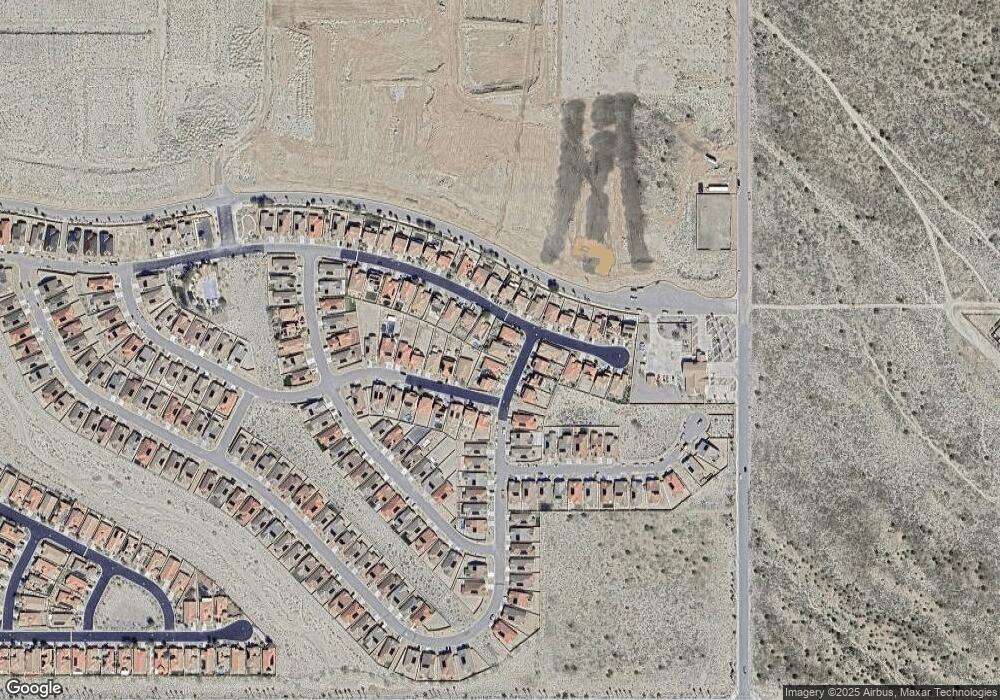
Map
Nearby Homes
- 62880 Loftwood St
- 62819 N Crescent St
- 62892 Loftwood St
- 62802 N Crescent St
- 62691 Rainbow Ln
- 62687 Rainbow Ln
- 11357 N Star Ln
- 11588 Sky Pointe Dr
- 62683 Rainbow Ln
- 62679 Rainbow Ln
- 62675 Rainbow Ln
- 11382 N Star Ln
- 11365 N Star Ln
- 11664 S Crescent St
- 11377 N Star Ln
- 11374 N Star Ln
- 11689 S Crescent St
- 11366 N Star Ln
- 11603 S Crescent St
- 11597 S Crescent St
- 11581 E Crescent St
- 11617 E Crescent St
- 62845 N Crescent St
- 11649 E Crescent St
- 62834 Kitetail Dr
- 62833 Crescent Dr
- 62833 N Crescent St
- 11610 E Crescent St
- 11594 E Crescent St
- 11634 E Crescent St
- 11658 E Crescent St
- 62820 Kitetail Dr
- 62852 N Crescent St
- 62864 N Crescent St
- 62840 N Crescent St
- 62876 N Crescent St
- 62812 Kitetail Dr
- 62834 N Crescent St
- 62843 Kitetail Dr
- 62835 Kitetail Dr