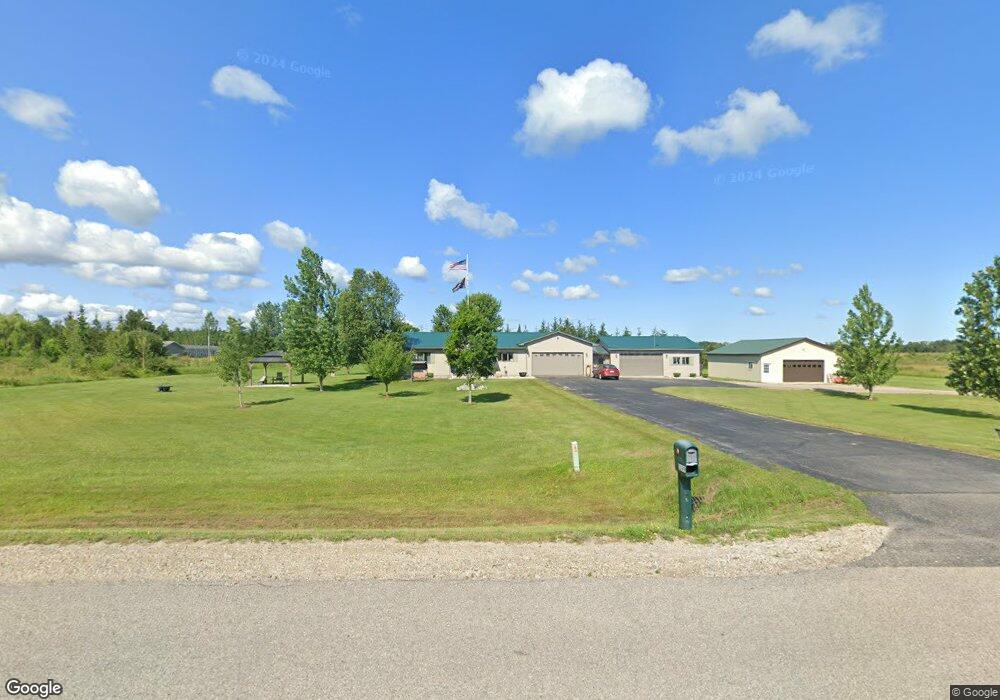
11599 Inverness Trail Rd Cheboygan, MI 49721
Estimated Value: $332,000 - $454,000
3
Beds
2
Baths
1,788
Sq Ft
$213/Sq Ft
Est. Value
About This Home
This home is located at 11599 Inverness Trail Rd, Cheboygan, MI 49721 and is currently estimated at $380,571, approximately $212 per square foot. 11599 Inverness Trail Rd is a home located in Cheboygan County with nearby schools including Cheboygan Intermediate School, East Elementary School, and Cheboygan Area High School.
Ownership History
Date
Name
Owned For
Owner Type
Purchase Details
Closed on
Jun 21, 2024
Sold by
Ginop Henry E
Bought by
Ginop Henry E and Ginop Evelyn L
Current Estimated Value
Purchase Details
Closed on
Jul 13, 2018
Sold by
Ginop Henry E and Ginop Evelyn L
Bought by
Ginop Henry E and Conklin-Ginop Evelyn L
Purchase Details
Closed on
Aug 1, 2013
Sold by
Frazier Tammy Lynn and Frazier Anthony B
Bought by
Ginop Henry E and Ginop Evelyn L
Home Financials for this Owner
Home Financials are based on the most recent Mortgage that was taken out on this home.
Original Mortgage
$132,800
Interest Rate
4.25%
Purchase Details
Closed on
Aug 27, 2008
Sold by
Coven David and Coven Jo
Bought by
Frazier Tammy Lynn and Frazier Anthony W
Purchase Details
Closed on
Jun 18, 2004
Sold by
Neuman Kevin P
Bought by
Coven David W and Coven Jo E
Purchase Details
Closed on
Oct 21, 1998
Sold by
Neuman Donald
Bought by
Neuman Kevin P
Create a Home Valuation Report for This Property
The Home Valuation Report is an in-depth analysis detailing your home's value as well as a comparison with similar homes in the area
Home Values in the Area
Average Home Value in this Area
Purchase History
| Date | Buyer | Sale Price | Title Company |
|---|---|---|---|
| Ginop Henry E | -- | -- | |
| Ginop Henry E | -- | -- | |
| Ginop Henry E | $165,000 | -- | |
| Frazier Tammy Lynn | $196,000 | -- | |
| Coven David W | $192,500 | -- | |
| Neuman Kevin P | -- | -- |
Source: Public Records
Mortgage History
| Date | Status | Borrower | Loan Amount |
|---|---|---|---|
| Previous Owner | Ginop Henry E | $132,800 |
Source: Public Records
Tax History Compared to Growth
Tax History
| Year | Tax Paid | Tax Assessment Tax Assessment Total Assessment is a certain percentage of the fair market value that is determined by local assessors to be the total taxable value of land and additions on the property. | Land | Improvement |
|---|---|---|---|---|
| 2025 | $2,151 | $185,100 | $0 | $0 |
| 2024 | $1,330 | $160,600 | $0 | $0 |
| 2023 | $1,274 | $146,400 | $0 | $0 |
| 2022 | $1,234 | $122,500 | $0 | $0 |
| 2021 | $1,947 | $121,300 | $0 | $121,300 |
| 2020 | $1,917 | $105,300 | $7,400 | $97,900 |
| 2019 | $1,810 | $105,400 | $7,400 | $98,000 |
| 2018 | $1,542 | $80,200 | $0 | $0 |
| 2017 | $1,453 | $79,800 | $0 | $0 |
| 2016 | $1,435 | $70,100 | $0 | $0 |
| 2015 | -- | $70,500 | $0 | $0 |
| 2014 | -- | $62,200 | $0 | $0 |
| 2012 | -- | $61,800 | $0 | $0 |
Source: Public Records
Map
Nearby Homes
- 12143 Inverness Trail Rd
- 622 W Lincoln Ave
- 506 Stempky St
- 0 Townline Rd Unit 201816742
- 726 S Huron St
- 912 S Huron St
- 100 Woodland Ct
- 370 Young St
- 207 N Western Ave
- 354 Sammons St
- 172 E Lincoln Ave
- 9840 N Straits Hwy
- 806 Division St
- V/L Trout Creek Rd
- 9768 N Straits Hwy
- V/L 2.70AC N Straits Hwy
- 700 Division St
- Lot H N Forest Dr
- Lot F N Forest Dr
- 111 Bell St
- 11599 Inverness Trail Rd
- 11568 Inverness Trail Rd
- 2140 Meridian Rd
- 2140 Meridian Rd
- 11524 Inverness Trail Rd
- 2031 Meridan Rd
- 2031 Meridian Rd
- 2160 Meridian Rd
- 0 Inverness Trail Unit 314635
- 0 Inverness Trail Unit 302800
- 0 Inverness Trail Unit 5.46 ACRES 269588
- 0 Inverness Trail Unit (2.5 ACRES) 255879
- 0 Inverness Trail Unit 238443
- 0 Inverness Trail Unit 78080039829
- 0 Inverness Trail Unit 78080021555
- 0 Inverness Trail Unit 78080026721
- 0 Inverness Trail Unit 78080026434
- 0 Inverness Trail Unit 2.50 acres
- 11765 Inverness Trail Rd
- 2175 Meridian Rd