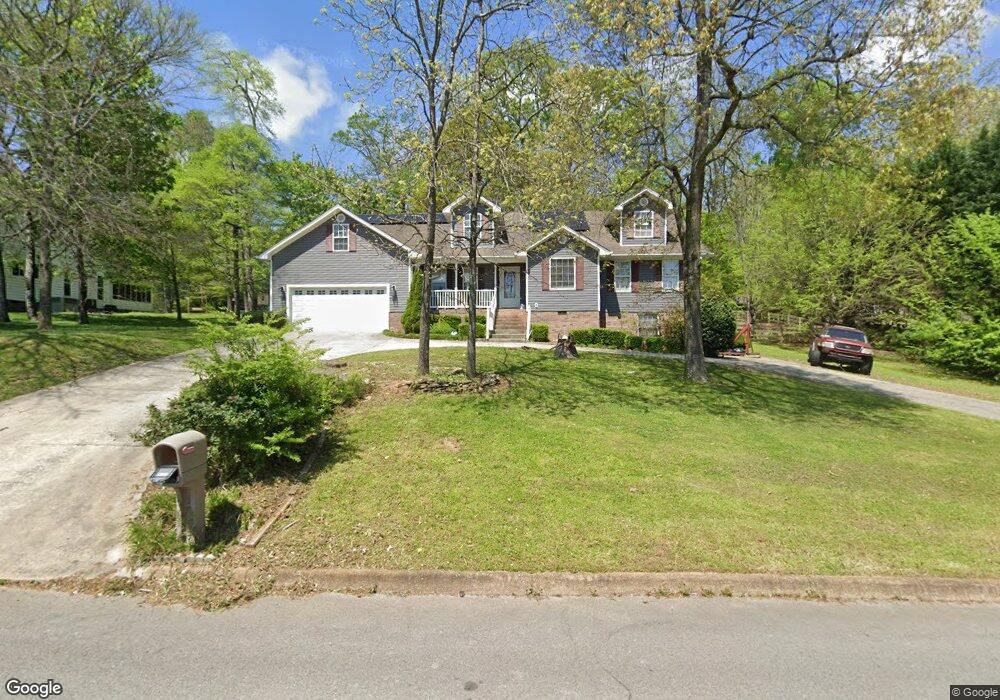
116 Ashley Ct Athens, TN 37303
Estimated Value: $354,000 - $421,000
3
Beds
2
Baths
2,026
Sq Ft
$189/Sq Ft
Est. Value
About This Home
This home is located at 116 Ashley Ct, Athens, TN 37303 and is currently estimated at $382,167, approximately $188 per square foot. 116 Ashley Ct is a home located in McMinn County with nearby schools including City Park Elementary School, Ingleside Elementary School, and Westside Elementary School.
Ownership History
Date
Name
Owned For
Owner Type
Purchase Details
Closed on
Oct 1, 2020
Sold by
Boruff Gary W and Boruff Christine
Bought by
Bradley Kalen L and Mcdermott Bridgett
Current Estimated Value
Home Financials for this Owner
Home Financials are based on the most recent Mortgage that was taken out on this home.
Original Mortgage
$260,200
Outstanding Balance
$231,434
Interest Rate
2.9%
Mortgage Type
New Conventional
Estimated Equity
$150,733
Purchase Details
Closed on
Jan 19, 2012
Sold by
Boruff Gary W
Bought by
Boruff Gary W and Boruff Christine
Purchase Details
Closed on
Sep 27, 2005
Sold by
Sharp Coy
Bought by
Boruff Gary W
Purchase Details
Closed on
Aug 19, 2005
Sold by
Collins Bruce W
Bought by
Perdue Nancy B
Purchase Details
Closed on
Jul 28, 1993
Bought by
Keith Meadows Venture
Purchase Details
Closed on
Feb 2, 1990
Bought by
Plemons Ray and Jessie Lou
Purchase Details
Closed on
Apr 1, 1986
Bought by
First Natl Bank & Trust Trustee - G Kei
Create a Home Valuation Report for This Property
The Home Valuation Report is an in-depth analysis detailing your home's value as well as a comparison with similar homes in the area
Home Values in the Area
Average Home Value in this Area
Purchase History
| Date | Buyer | Sale Price | Title Company |
|---|---|---|---|
| Bradley Kalen L | $265,000 | Valley Title Services Llc | |
| Boruff Gary W | -- | -- | |
| Boruff Gary W | $29,000 | -- | |
| Perdue Nancy B | $30,000 | -- | |
| Keith Meadows Venture | -- | -- | |
| Plemons Ray | -- | -- | |
| First Natl Bank & Trust Trustee - G Kei | -- | -- |
Source: Public Records
Mortgage History
| Date | Status | Borrower | Loan Amount |
|---|---|---|---|
| Open | Bradley Kalen L | $260,200 |
Source: Public Records
Tax History Compared to Growth
Tax History
| Year | Tax Paid | Tax Assessment Tax Assessment Total Assessment is a certain percentage of the fair market value that is determined by local assessors to be the total taxable value of land and additions on the property. | Land | Improvement |
|---|---|---|---|---|
| 2024 | $1,626 | $77,800 | $6,600 | $71,200 |
| 2023 | $1,626 | $77,800 | $6,600 | $71,200 |
| 2022 | $1,525 | $52,700 | $6,600 | $46,100 |
| 2021 | $1,525 | $52,700 | $6,600 | $46,100 |
| 2020 | $1,483 | $52,700 | $6,600 | $46,100 |
| 2019 | $1,483 | $52,700 | $6,600 | $46,100 |
| 2018 | $1,483 | $52,700 | $6,600 | $46,100 |
| 2017 | $1,648 | $55,325 | $11,050 | $44,275 |
| 2016 | $1,648 | $55,325 | $11,050 | $44,275 |
| 2015 | -- | $54,825 | $11,050 | $43,775 |
| 2014 | $1,507 | $54,832 | $0 | $0 |
Source: Public Records
Map
Nearby Homes
- 114 Ashley Court Dr
- 269 Fyke Dr
- 514 Lynnwood Dr
- 501 Lynnwood Dr
- 504 Lynnwood Dr
- Lot 2 A Tennessee 39
- 1313 English Ln
- 922 Barnabas St
- 613 Gideon St
- 814 Cedar Springs Rd
- 707 Elizabeth St
- 620 Tell St
- 909 S Matlock Ave
- 508 W College St
- 727 Southern Pkwy
- 533 Long Mill Rd
- 00 Tell St
- 709 Southern Pkwy
- 717 James St
- 13 Douglas St