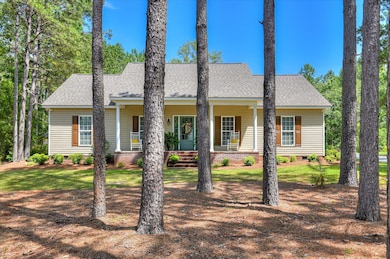
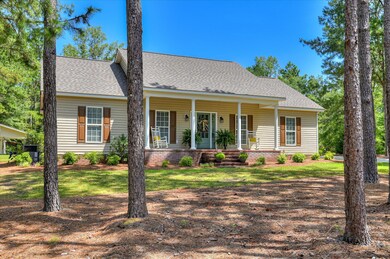
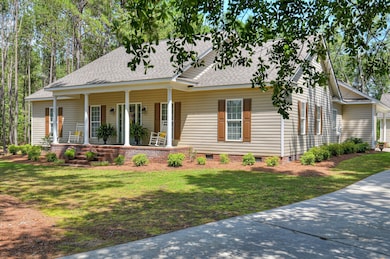
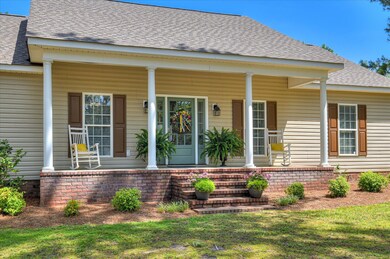
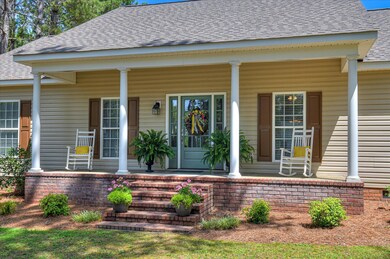
Charming home on 3.2 Acres with Pool, Pool House & ShopThis meticulously maintained, one-owner home offers the perfect blend of comfort, space, and functionality, all set on 3.2 beautiful acres just north of Waynesboro. Built in 2007 and lovingly cared for ever since, this 3-bedroom, 2-bath home features an in-ground swimming pool, pool house, 30x30-foot shop, garden shed, and more--creating a true turnkey property for living and entertaining.From the moment you arrive, you're welcomed by impressive curb appeal. Mature landscaping frames a charming rocking chair front porch, setting the stage for the inviting interior. Inside, the foyer opens to a formal dining room and a spacious living room with vaulted ceiling and access to the back deck, which overlooks the pool and expansive grounds.The well-appointed eat-in kitchen includes solid-surface countertops, stained cabinetry, stainless steel appliances, generous storage, and a bright breakfast area.The split-bedroom floorplan places the primary suite on one end of the home, offering a large bedroom with tray ceiling, walk-in closets, and a luxurious en-suite bath featuring a double vanity, garden tub, and separate shower. Two additional bedrooms and a full bath are located on the opposite end of the home.Additional highlights include: Double carport with attached storage room Concrete driveway leading to a 30x30 shop with two automatic rollup doors, pedestrian entry, power, lighting, and shed-roof storage--ideal for vehicles, tools, or hobbies In-ground swimming pool with a new liner, expansive concrete deck, and decorative wrought-iron fencing Pool house with a full-length covered porch, large recreation room with kitchenette (cabinets, sink, fridge), full bathroom with shower, and storage room--perfect for gatherings Cook shed for BBQs or extra covered storage Garden shed with front porch, large side entry for equipment, and space for all your gardening needs Beautiful landscaping and ornamental plantings throughout the propertyThis is a special opportunity to enjoy peaceful, private living with room to spread out and entertain in style--all just minutes from Waynesboro. If you're looking for a complete setup with all the extras already in place, this property checks every box.Property is comprised of 3 lots: parcels 064 120, 064 121 and 064 119.