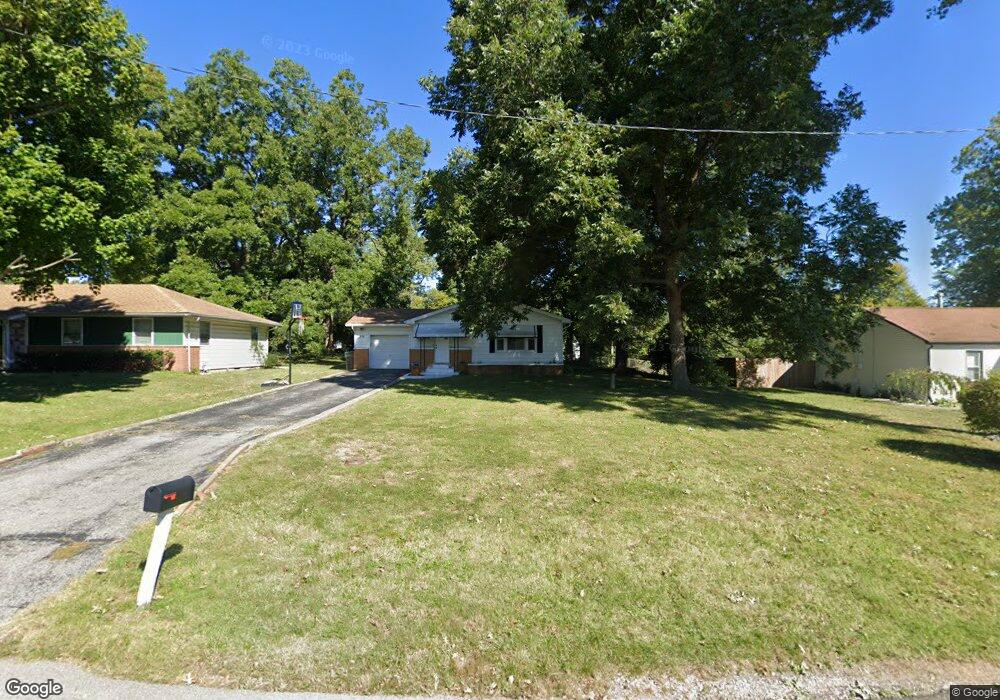
116 Belt Ave O Fallon, IL 62269
Estimated Value: $144,000 - $157,000
3
Beds
1
Bath
1,161
Sq Ft
$128/Sq Ft
Est. Value
About This Home
This home is located at 116 Belt Ave, O Fallon, IL 62269 and is currently estimated at $148,667, approximately $128 per square foot. 116 Belt Ave is a home located in St. Clair County with nearby schools including Central Elementary School, Joseph Arthur Middle School, and O'Fallon Township High School.
Ownership History
Date
Name
Owned For
Owner Type
Purchase Details
Closed on
Jan 23, 2015
Sold by
Fowler James M
Bought by
Fowler James M and Fowler Johanna M
Current Estimated Value
Home Financials for this Owner
Home Financials are based on the most recent Mortgage that was taken out on this home.
Original Mortgage
$67,900
Outstanding Balance
$23,720
Interest Rate
3.8%
Mortgage Type
New Conventional
Estimated Equity
$124,947
Purchase Details
Closed on
Nov 17, 2009
Sold by
Gilly Jean M
Bought by
Fowler James M
Home Financials for this Owner
Home Financials are based on the most recent Mortgage that was taken out on this home.
Original Mortgage
$75,605
Interest Rate
4.9%
Mortgage Type
FHA
Purchase Details
Closed on
Sep 10, 2009
Sold by
Gilly Jean M
Bought by
Gilly Jean M
Purchase Details
Closed on
Nov 5, 2008
Sold by
Brown Dorothy J
Bought by
Brown Dorothy J and Dorothy J Brown Revocable Trust
Create a Home Valuation Report for This Property
The Home Valuation Report is an in-depth analysis detailing your home's value as well as a comparison with similar homes in the area
Home Values in the Area
Average Home Value in this Area
Purchase History
| Date | Buyer | Sale Price | Title Company |
|---|---|---|---|
| Fowler James M | -- | Southern Illinois Real Estat | |
| Fowler James M | $77,000 | Benchmark Title Company | |
| Gilly Jean M | -- | None Available | |
| Brown Dorothy J | -- | None Available |
Source: Public Records
Mortgage History
| Date | Status | Borrower | Loan Amount |
|---|---|---|---|
| Open | Fowler James M | $67,900 | |
| Closed | Fowler James M | $75,605 |
Source: Public Records
Tax History Compared to Growth
Tax History
| Year | Tax Paid | Tax Assessment Tax Assessment Total Assessment is a certain percentage of the fair market value that is determined by local assessors to be the total taxable value of land and additions on the property. | Land | Improvement |
|---|---|---|---|---|
| 2024 | $2,367 | $33,390 | $4,129 | $29,261 |
| 2023 | $2,256 | $29,543 | $3,653 | $25,890 |
| 2022 | $1,995 | $26,423 | $3,579 | $22,844 |
| 2021 | $1,966 | $25,079 | $3,397 | $21,682 |
| 2020 | $1,951 | $23,757 | $3,218 | $20,539 |
| 2019 | $1,921 | $23,757 | $3,218 | $20,539 |
| 2018 | $1,928 | $23,554 | $3,441 | $20,113 |
| 2017 | $1,650 | $22,599 | $3,302 | $19,297 |
| 2016 | $1,396 | $22,088 | $3,227 | $18,861 |
| 2014 | $662 | $22,392 | $2,602 | $19,790 |
| 2013 | $1,801 | $22,805 | $2,650 | $20,155 |
Source: Public Records
Map
Nearby Homes
- 205 Belt Ave
- 128 Alice Dr
- 509 Long Dr
- 208 Ellen Ln
- 210 Meadowbrook Dr
- 209 Ashurst Ln
- 212 Ashurst Ln
- 906 Powell Dr
- 1229 Belclare Ct
- 1232 Old Town Bridge
- 21 Faith Dr
- 18 Del Ray Dr
- 762 Kelley Dr
- 1706 W Washington St
- 2 Catalina Dr
- 894 Misty Valley Rd
- 6509 Old Collinsville Rd
- 924 Holliday Dr
- 712 Creekwood Ct
- 716 Creekwood Ct