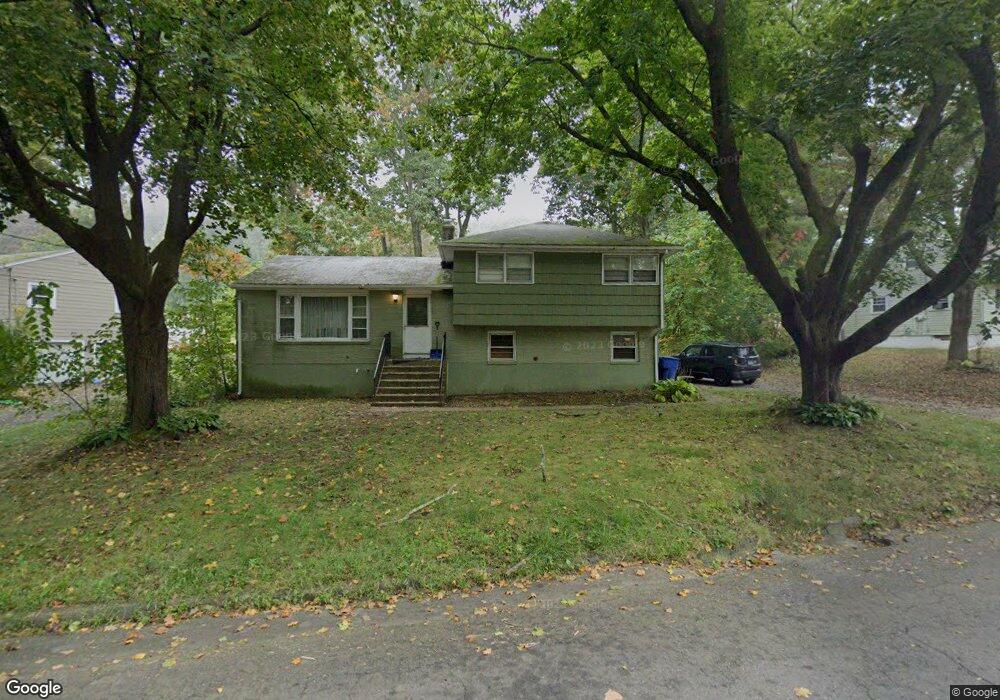
116 Bracewood Rd Waterbury, CT 06706
South End District NeighborhoodEstimated Value: $315,000 - $346,000
3
Beds
1
Bath
1,200
Sq Ft
$273/Sq Ft
Est. Value
About This Home
This home is located at 116 Bracewood Rd, Waterbury, CT 06706 and is currently estimated at $327,755, approximately $273 per square foot. 116 Bracewood Rd is a home located in New Haven County with nearby schools including Wendell L. Cross Elementary School, Michael F. Wallace Middle School, and Crosby High School.
Ownership History
Date
Name
Owned For
Owner Type
Purchase Details
Closed on
Aug 28, 2006
Sold by
Kaplan Libbye and Kaplan Jerome H
Bought by
Farrelly Daniel J
Current Estimated Value
Home Financials for this Owner
Home Financials are based on the most recent Mortgage that was taken out on this home.
Original Mortgage
$110,000
Outstanding Balance
$66,633
Interest Rate
6.83%
Mortgage Type
Purchase Money Mortgage
Estimated Equity
$261,122
Create a Home Valuation Report for This Property
The Home Valuation Report is an in-depth analysis detailing your home's value as well as a comparison with similar homes in the area
Home Values in the Area
Average Home Value in this Area
Purchase History
| Date | Buyer | Sale Price | Title Company |
|---|---|---|---|
| Farrelly Daniel J | $185,000 | -- |
Source: Public Records
Mortgage History
| Date | Status | Borrower | Loan Amount |
|---|---|---|---|
| Open | Farrelly Daniel J | $110,000 | |
| Previous Owner | Farrelly Daniel J | $78,750 | |
| Previous Owner | Farrelly Daniel J | $42,000 |
Source: Public Records
Tax History Compared to Growth
Tax History
| Year | Tax Paid | Tax Assessment Tax Assessment Total Assessment is a certain percentage of the fair market value that is determined by local assessors to be the total taxable value of land and additions on the property. | Land | Improvement |
|---|---|---|---|---|
| 2025 | $6,892 | $153,230 | $27,650 | $125,580 |
| 2024 | $7,576 | $153,230 | $27,650 | $125,580 |
| 2023 | $8,304 | $153,230 | $27,650 | $125,580 |
| 2022 | $5,548 | $92,150 | $27,670 | $64,480 |
| 2021 | $5,548 | $92,150 | $27,670 | $64,480 |
| 2020 | $5,548 | $92,150 | $27,670 | $64,480 |
| 2019 | $5,548 | $92,150 | $27,670 | $64,480 |
| 2018 | $5,548 | $92,150 | $27,670 | $64,480 |
| 2017 | $5,808 | $96,470 | $27,680 | $68,790 |
| 2016 | $5,808 | $96,470 | $27,680 | $68,790 |
| 2015 | $5,616 | $96,470 | $27,680 | $68,790 |
| 2014 | $5,616 | $96,470 | $27,680 | $68,790 |
Source: Public Records
Map
Nearby Homes
- 70 Glenrock Rd
- 178 Peach Orchard Rd
- 60 Gayfield Rd
- 89 Rockledge Dr
- 500 Plank Rd
- 44 Shadybrook Ln
- 260 Scott Rd Unit 1
- 106 Brookdale Ln
- 9 Cheryl Ln
- 61 Harpers Ferry Rd
- 22 Sycamore Ln
- 147 Sprucedale Dr
- 379 Scott Rd
- 35 Mountain Village Rd Unit 30
- 72 Morris Rd
- 15 Clark Hill Rd
- 329 Scott Rd Unit B8
- 185 Eastside Blvd
- 22 Knoll St
- 425 Scott Rd