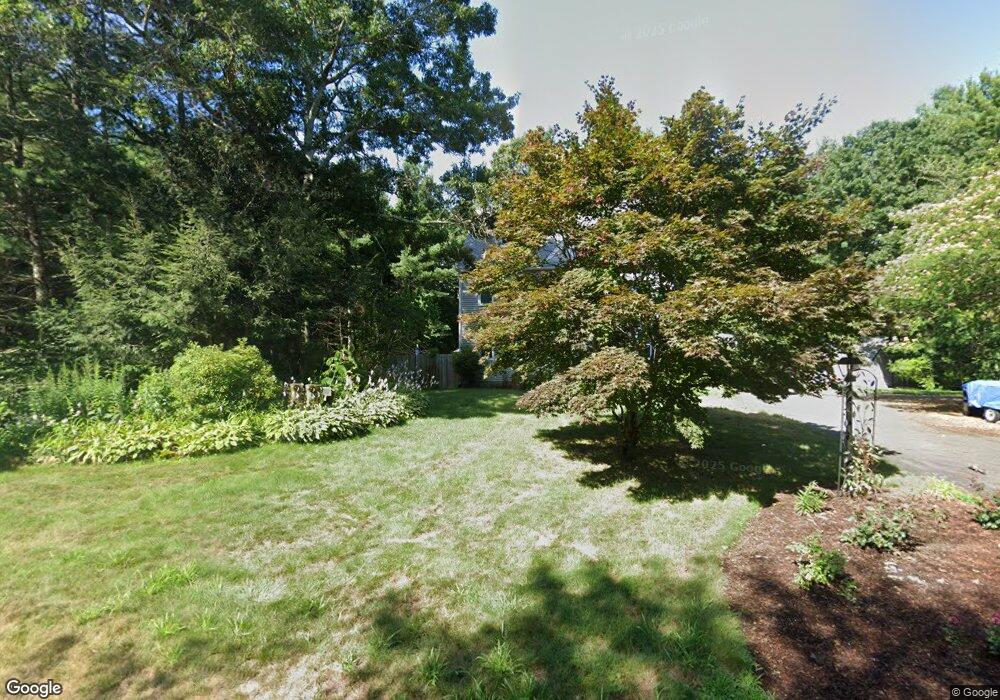
116 Colby Dr Middleboro, MA 02346
Estimated Value: $608,000 - $682,000
3
Beds
2
Baths
1,700
Sq Ft
$372/Sq Ft
Est. Value
About This Home
This home is located at 116 Colby Dr, Middleboro, MA 02346 and is currently estimated at $632,904, approximately $372 per square foot. 116 Colby Dr is a home located in Plymouth County with nearby schools including Mary K. Goode Elementary School.
Ownership History
Date
Name
Owned For
Owner Type
Purchase Details
Closed on
Mar 8, 2012
Sold by
Brown David M and Brown Michelle B
Bought by
Brown David M and Brown Michelle B
Current Estimated Value
Home Financials for this Owner
Home Financials are based on the most recent Mortgage that was taken out on this home.
Original Mortgage
$225,000
Outstanding Balance
$22,714
Interest Rate
3.99%
Mortgage Type
New Conventional
Estimated Equity
$610,190
Purchase Details
Closed on
Jun 24, 1996
Sold by
Searles Bldrs Inc
Bought by
Brown David M and Brown Michelle B
Create a Home Valuation Report for This Property
The Home Valuation Report is an in-depth analysis detailing your home's value as well as a comparison with similar homes in the area
Home Values in the Area
Average Home Value in this Area
Purchase History
| Date | Buyer | Sale Price | Title Company |
|---|---|---|---|
| Brown David M | -- | -- | |
| Brown David M | $150,000 | -- |
Source: Public Records
Mortgage History
| Date | Status | Borrower | Loan Amount |
|---|---|---|---|
| Open | Brown David M | $225,000 | |
| Previous Owner | Brown David M | $110,000 | |
| Previous Owner | Brown David M | $200,000 | |
| Previous Owner | Brown David M | $20,000 | |
| Previous Owner | Brown David M | $135,000 |
Source: Public Records
Tax History
| Year | Tax Paid | Tax Assessment Tax Assessment Total Assessment is a certain percentage of the fair market value that is determined by local assessors to be the total taxable value of land and additions on the property. | Land | Improvement |
|---|---|---|---|---|
| 2025 | $6,489 | $483,900 | $180,700 | $303,200 |
| 2024 | $6,557 | $484,300 | $172,300 | $312,000 |
| 2023 | $6,063 | $425,800 | $172,300 | $253,500 |
| 2022 | $5,632 | $366,200 | $149,600 | $216,600 |
| 2021 | $5,695 | $350,000 | $137,400 | $212,600 |
| 2020 | $5,383 | $339,000 | $137,400 | $201,600 |
| 2019 | $5,248 | $339,000 | $137,400 | $201,600 |
| 2018 | $4,877 | $312,600 | $124,900 | $187,700 |
| 2017 | $4,649 | $294,800 | $120,100 | $174,700 |
| 2016 | $4,575 | $287,400 | $113,500 | $173,900 |
| 2015 | $4,395 | $278,500 | $113,500 | $165,000 |
Source: Public Records
Map
Nearby Homes
Your Personal Tour Guide
Ask me questions while you tour the home.