116 Creekshire Crescent Newport News, VA 23603
Lee Hall NeighborhoodEstimated Value: $250,000 - $267,000
2
Beds
3
Baths
1,454
Sq Ft
$178/Sq Ft
Est. Value
About This Home
This home is located at 116 Creekshire Crescent, Newport News, VA 23603 and is currently estimated at $259,294, approximately $178 per square foot. 116 Creekshire Crescent is a home located in Newport News City with nearby schools including Katherine G. Johnson Elementary School, Mary Passage Middle School, and Woodside High School.
Ownership History
Date
Name
Owned For
Owner Type
Purchase Details
Closed on
Mar 4, 2021
Sold by
Lawrence Stephen
Bought by
Grant Michelle Denise
Current Estimated Value
Home Financials for this Owner
Home Financials are based on the most recent Mortgage that was taken out on this home.
Original Mortgage
$169,915
Outstanding Balance
$152,317
Interest Rate
2.7%
Mortgage Type
New Conventional
Estimated Equity
$106,977
Purchase Details
Closed on
Apr 17, 2014
Sold by
Hiskey Maria M
Bought by
Lawrence Stephen
Home Financials for this Owner
Home Financials are based on the most recent Mortgage that was taken out on this home.
Original Mortgage
$147,283
Interest Rate
4.25%
Mortgage Type
FHA
Purchase Details
Closed on
May 11, 2000
Sold by
Allen Molly C
Bought by
Hiskey Maria
Home Financials for this Owner
Home Financials are based on the most recent Mortgage that was taken out on this home.
Original Mortgage
$83,300
Interest Rate
8.1%
Create a Home Valuation Report for This Property
The Home Valuation Report is an in-depth analysis detailing your home's value as well as a comparison with similar homes in the area
Home Values in the Area
Average Home Value in this Area
Purchase History
| Date | Buyer | Sale Price | Title Company |
|---|---|---|---|
| Grant Michelle Denise | $199,900 | Attorney | |
| Lawrence Stephen | $143,700 | -- | |
| Hiskey Maria | $88,500 | -- |
Source: Public Records
Mortgage History
| Date | Status | Borrower | Loan Amount |
|---|---|---|---|
| Open | Grant Michelle Denise | $169,915 | |
| Previous Owner | Lawrence Stephen | $147,283 | |
| Previous Owner | Hiskey Maria | $83,300 |
Source: Public Records
Tax History Compared to Growth
Tax History
| Year | Tax Paid | Tax Assessment Tax Assessment Total Assessment is a certain percentage of the fair market value that is determined by local assessors to be the total taxable value of land and additions on the property. | Land | Improvement |
|---|---|---|---|---|
| 2024 | $2,618 | $221,900 | $44,000 | $177,900 |
| 2023 | $2,610 | $208,700 | $44,000 | $164,700 |
| 2022 | $2,530 | $198,600 | $44,000 | $154,600 |
| 2021 | $2,045 | $167,600 | $40,000 | $127,600 |
| 2020 | $1,973 | $149,700 | $40,000 | $109,700 |
| 2019 | $1,942 | $147,500 | $40,000 | $107,500 |
| 2018 | $1,939 | $147,500 | $40,000 | $107,500 |
| 2017 | $1,889 | $143,400 | $40,000 | $103,400 |
| 2016 | $1,924 | $146,600 | $40,000 | $106,600 |
| 2015 | $1,918 | $146,600 | $40,000 | $106,600 |
| 2014 | $1,786 | $143,700 | $40,000 | $103,700 |
Source: Public Records
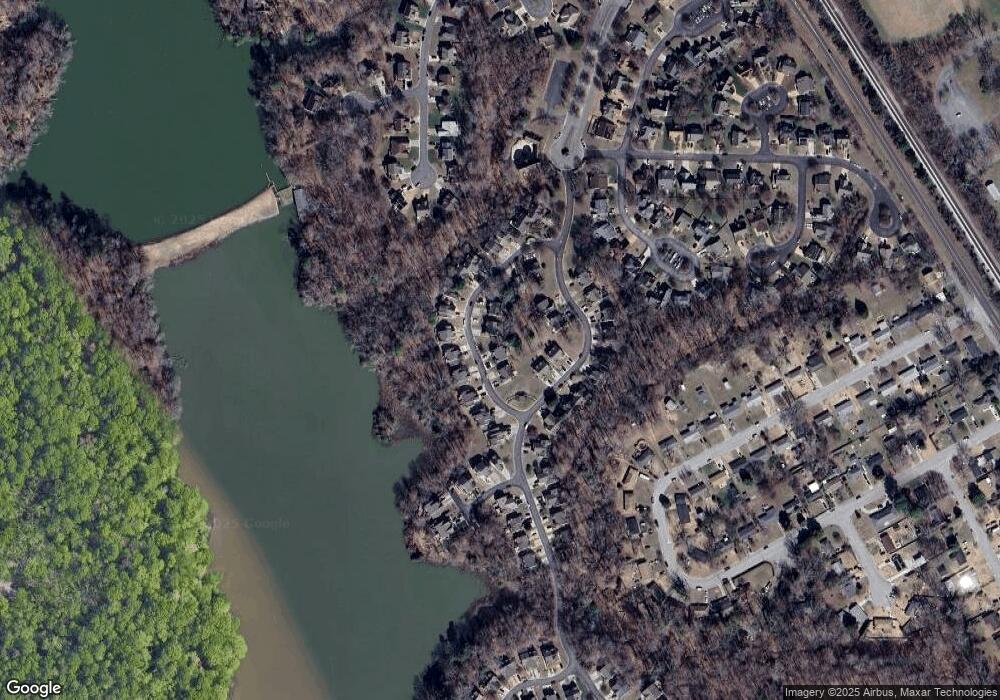
Map
Nearby Homes
- 314 Oak Ridge Dr
- 47 Edgemoor Dr
- 110 View Pointe Dr
- 6 Cottage Ln
- 367 Bridgewater Dr
- 58 Ripley St
- 333 Bridgewater Dr
- 224 Misty Point Ln
- 220 Misty Point Ln
- 218 Misty Point Ln
- 17319 Warwick Blvd
- 17317 Warwick Blvd
- 17247 Warwick Blvd
- 526 Yorktown Rd
- 1641 Skiffes Creek Cir
- 1653 Skiffes Creek Cir
- 531 Taliaferro Rd
- 1704 Skiffes Creek Cir
- 110 Tarleton Bivouac
- 211 Old Bridge Ct
- 114 Creekshire Crescent
- 124 Creekshire Crescent
- 112 Creekshire Crescent
- 126 Creekshire Crescent
- 110 Creekshire Crescent
- 128 Creekshire Crescent
- 130 Creekshire Crescent
- 117 Creekshire Crescent
- 119 Creekshire Crescent
- 111 Creekstone Dr
- 115 Creekshire Crescent
- 113 Creekstone Dr
- 123 Creekshire Crescent
- 115 Creekstone Dr
- 113 Creekshire Crescent
- 125 Creekshire Crescent
- 117 Creekstone Dr
- 111 Creekshire Crescent
- 140 Creekshire Crescent
- 135 Creekstone Dr