J
Seller's Agent in 2019
Joseph Chase Sumner
Re/Max Of Albany

Estimated Value: $129,499 - $190,000
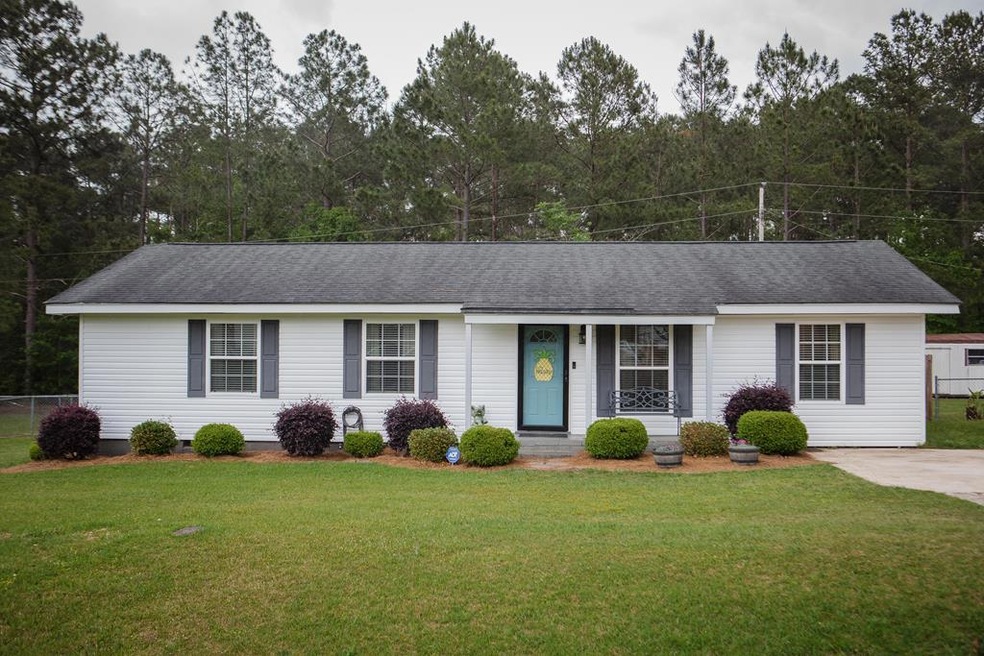
AMAZING 3 BEDROOM 2 BATH HOME LOCATED IN SYLVESTER!!!!!! This home would be perfect for a first time buyer or anyone looking to downsize. Outside features a spacious .27 acre property with a completely fenced backyard, a large workshop, large covered back deck, fire pit area, and even a swing set. Inside the home luxury vinyl flooring flows seamlessly through the living room, hall, and master bedroom. The master features a private bathroom with tile flooring, a shower/tub combo, and plenty of room for large furniture. Just up the hall are the other two bedrooms and second bathroom. Both guest rooms feature carpet flooring, spacious closets, and both nicely sized. The guest bath features tile flooring, a shower/tub combo, and modern vanity. Located just off of the living room you'll find the kitchen and dining room area, both feature tile flooring and modern lighting. The kitchen has matching appliances, lots of counter/cabinet space, a huge farm sink, and a great tile backsplash. Large double pane windows throughout the home allow tons of exterior lighting to give you the welcome home feeling every time you step through the door. Call today to schedule your private tour.
Last Agent to Sell the Property
Joseph Chase Sumner
Re/Max Of Albany Brokerage Phone: 2294341600 License #380794 Listed on: 04/28/2019
Last Buyer's Agent
Joseph Chase Sumner
Re/Max Of Albany Brokerage Phone: 2294341600 License #380794 Listed on: 04/28/2019
| Date | Buyer | Sale Price | Title Company |
|---|---|---|---|
| Harrell Sharon | $131,000 | -- | |
| Harrell Jessica | $125,500 | -- | |
| Fraley James | $99,900 | -- | |
| Fraley James | $54,000 | -- |
| Date | Status | Borrower | Loan Amount |
|---|---|---|---|
| Previous Owner | Harrell Jessica | $128,282 | |
| Previous Owner | Fraley James | $98,090 | |
| Previous Owner | Fraley James | $45,313 |
| Date | Event | Price | List to Sale | Price per Sq Ft |
|---|---|---|---|---|
| 06/10/2019 06/10/19 | Sold | $125,500 | -- | $93 / Sq Ft |
| 04/28/2019 04/28/19 | Pending | -- | -- | -- |
| Year | Tax Paid | Tax Assessment Tax Assessment Total Assessment is a certain percentage of the fair market value that is determined by local assessors to be the total taxable value of land and additions on the property. | Land | Improvement |
|---|---|---|---|---|
| 2025 | $1,555 | $56,690 | $2,700 | $53,990 |
| 2024 | $1,017 | $27,538 | $3,958 | $23,580 |
| 2023 | $1,017 | $27,538 | $3,958 | $23,580 |
| 2022 | $991 | $27,538 | $3,958 | $23,580 |
| 2021 | $989 | $27,538 | $3,958 | $23,580 |
| 2020 | $934 | $27,538 | $3,958 | $23,580 |
| 2019 | $933 | $27,538 | $3,958 | $23,580 |
| 2018 | $934 | $27,538 | $3,958 | $23,580 |
| 2017 | $881 | $25,996 | $3,958 | $22,038 |
| 2016 | $877 | $25,996 | $3,958 | $22,038 |
| 2015 | $826 | $25,996 | $3,958 | $22,038 |
| 2014 | $826 | $25,995 | $3,958 | $22,038 |
| 2013 | -- | $25,995 | $3,958 | $22,038 |
| 2012 | -- | $25,995 | $3,957 | $22,037 |
J
Seller's Agent in 2019
Joseph Chase Sumner
Re/Max Of Albany
Source: Albany Board of REALTORS®
MLS Number: 142747
APN: SV190-101-000
Ask me questions while you tour the home.