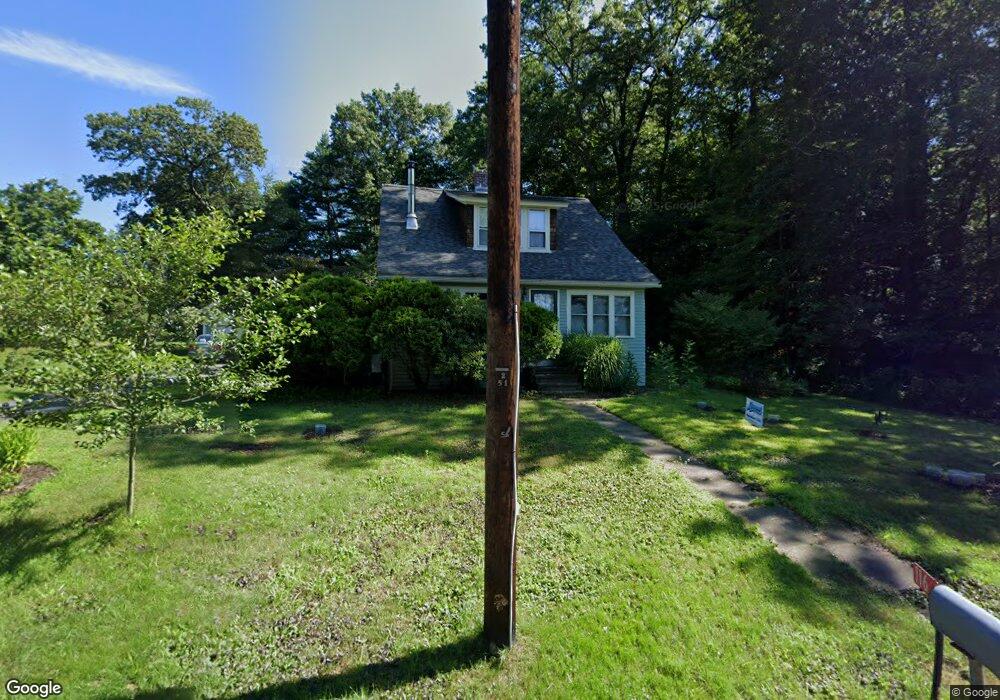
116 Depot Rd Hatfield, MA 01038
Estimated Value: $416,301 - $496,000
3
Beds
2
Baths
1,484
Sq Ft
$302/Sq Ft
Est. Value
About This Home
This home is located at 116 Depot Rd, Hatfield, MA 01038 and is currently estimated at $448,075, approximately $301 per square foot. 116 Depot Rd is a home located in Hampshire County with nearby schools including Hatfield Elementary School and Smith Academy.
Ownership History
Date
Name
Owned For
Owner Type
Purchase Details
Closed on
Jun 26, 1998
Sold by
Epstein Adam S
Bought by
Gow Kathleen A and Lee Hollington
Current Estimated Value
Purchase Details
Closed on
Jun 20, 1994
Sold by
Shattuck Gerald M
Bought by
Epstein Adam S
Create a Home Valuation Report for This Property
The Home Valuation Report is an in-depth analysis detailing your home's value as well as a comparison with similar homes in the area
Home Values in the Area
Average Home Value in this Area
Purchase History
| Date | Buyer | Sale Price | Title Company |
|---|---|---|---|
| Gow Kathleen A | $155,000 | -- | |
| Epstein Adam S | $120,000 | -- |
Source: Public Records
Mortgage History
| Date | Status | Borrower | Loan Amount |
|---|---|---|---|
| Open | Epstein Adam S | $60,000 | |
| Closed | Epstein Adam S | $80,640 | |
| Closed | Epstein Adam S | $25,000 |
Source: Public Records
Tax History
| Year | Tax Paid | Tax Assessment Tax Assessment Total Assessment is a certain percentage of the fair market value that is determined by local assessors to be the total taxable value of land and additions on the property. | Land | Improvement |
|---|---|---|---|---|
| 2025 | $4,850 | $350,400 | $131,400 | $219,000 |
| 2024 | $4,634 | $302,700 | $114,500 | $188,200 |
| 2023 | $3,867 | $286,900 | $108,800 | $178,100 |
| 2022 | $3,658 | $267,600 | $103,200 | $164,400 |
| 2021 | $3,584 | $252,600 | $93,800 | $158,800 |
| 2020 | $3,418 | $252,600 | $93,800 | $158,800 |
| 2019 | $3,204 | $230,700 | $91,900 | $138,800 |
| 2018 | $3,057 | $225,100 | $91,900 | $133,200 |
| 2017 | $2,922 | $221,000 | $91,900 | $129,100 |
| 2016 | $2,894 | $219,600 | $91,900 | $127,700 |
| 2015 | $2,714 | $206,100 | $82,600 | $123,500 |
| 2014 | $2,611 | $206,100 | $82,600 | $123,500 |
Source: Public Records
Map
Nearby Homes
- 59 N Hatfield Rd
- 151 Pantry Rd
- 0 Straits Rd
- 149 Prospect St
- 71 Chestnut St
- 8 Aloha Dr
- 3 Frost Ln
- 0 North St Unit 73407299
- 58 Main St Unit 4
- 58 Main St Unit 3
- 6 Shattuck Rd
- 18 Elm St
- 15 S Plain Rd
- Lot 3 Roosevelt St
- 14 Hawley Rd
- 43 Laurel Park Unit 43
- 27 River Dr
- 0 Greenfield Rd Unit 73472322
- 32 Stonewall Dr
- 26 S Main St
Your Personal Tour Guide
Ask me questions while you tour the home.