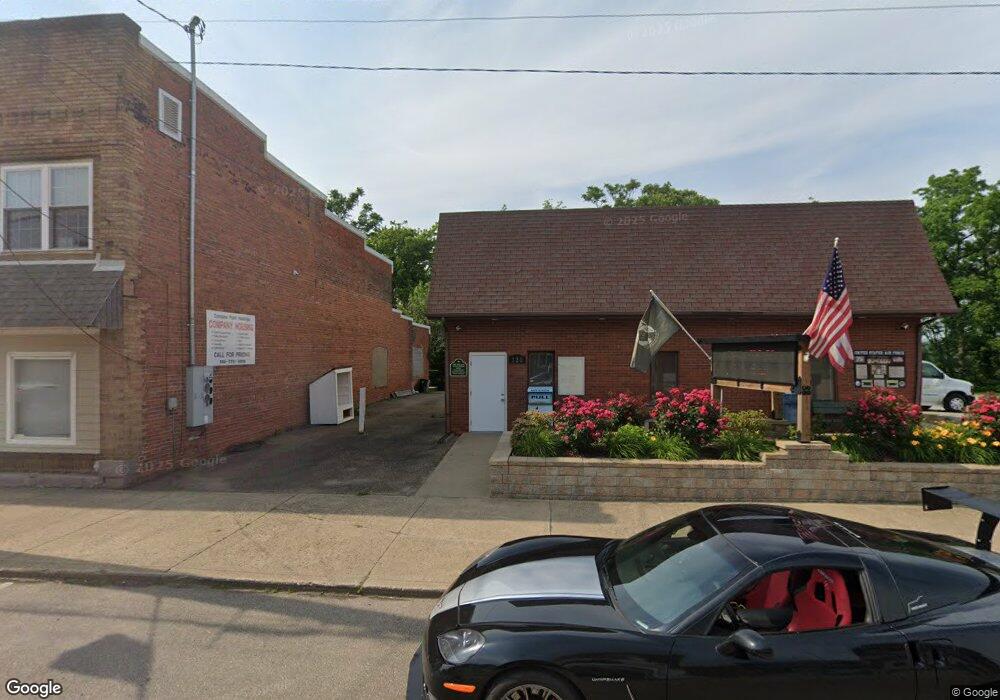
116 E High St Flushing, OH 43977
Studio
--
Bath
4,200
Sq Ft
9,148
Sq Ft Lot
About This Home
This home is located at 116 E High St, Flushing, OH 43977. 116 E High St is a home located in Belmont County with nearby schools including Union Local Elementary School, Union Local Middle School, and Union Local High School.
Ownership History
Date
Name
Owned For
Owner Type
Purchase Details
Closed on
Jun 17, 2010
Sold by
Mcgary Shelby L and Mcgary Julie R
Bought by
Compass Point Holdings
Home Financials for this Owner
Home Financials are based on the most recent Mortgage that was taken out on this home.
Original Mortgage
$25,600
Outstanding Balance
$16,959
Interest Rate
4.97%
Mortgage Type
Commercial
Purchase Details
Closed on
Oct 10, 1996
Sold by
Mcgary Shelby L
Bought by
Mcgary Shelby L
Purchase Details
Closed on
Jan 1, 1986
Sold by
Puch John H
Bought by
Puch John H
Create a Home Valuation Report for This Property
The Home Valuation Report is an in-depth analysis detailing your home's value as well as a comparison with similar homes in the area
Purchase History
| Date | Buyer | Sale Price | Title Company |
|---|---|---|---|
| Compass Point Holdings | $32,000 | Attorney | |
| Mcgary Shelby L | $12,000 | -- | |
| Puch John H | -- | -- |
Source: Public Records
Mortgage History
| Date | Status | Borrower | Loan Amount |
|---|---|---|---|
| Open | Compass Point Holdings | $25,600 |
Source: Public Records
Tax History
| Year | Tax Paid | Tax Assessment Tax Assessment Total Assessment is a certain percentage of the fair market value that is determined by local assessors to be the total taxable value of land and additions on the property. | Land | Improvement |
|---|---|---|---|---|
| 2025 | $751 | $15,770 | $6,790 | $8,980 |
| 2024 | $722 | $15,770 | $6,790 | $8,980 |
| 2023 | $441 | $8,740 | $1,600 | $7,140 |
| 2022 | $454 | $8,743 | $1,603 | $7,140 |
| 2021 | $461 | $8,743 | $1,603 | $7,140 |
| 2020 | $462 | $8,740 | $1,600 | $7,140 |
| 2019 | $488 | $8,740 | $1,600 | $7,140 |
| 2018 | $462 | $8,740 | $1,600 | $7,140 |
| 2017 | $459 | $8,430 | $1,560 | $6,870 |
| 2016 | $445 | $8,430 | $1,560 | $6,870 |
| 2015 | $456 | $8,430 | $1,560 | $6,870 |
| 2014 | $462 | $7,880 | $1,460 | $6,420 |
| 2013 | $489 | $7,880 | $1,460 | $6,420 |
Source: Public Records
Map
Nearby Homes
- 117 A&B High St
- 39775 Rosemary Camp Rd
- 41152 Black Oak Rd
- 0 Holloway Rd State Rt 331 Unit 5067951
- 409 Ashton St
- 77900 Slater Rd
- 70799 Bannock Uniontown Rd
- 38400 Cadiz-Piedmont Rd
- INLOT 19 Havenwood
- V/L Shephard Rd
- 19 acres Saffell Rd
- 15 acres Saffell Rd
- 35 acres Saffell Rd
- 67290 National New Lafferty Rd
- 73310 Hazelwood Hills Rd
- 34683 Sunshine Rd
- 34810 Nelson Dr
- 34670 Nelson Dr
- 69680 Main St
- 67174 Pancoast Rd S
- 118 High St
- 110 High St
- 101 A & 101 B Market St
- 208 High St
- 101A Market St
- 101 Market St
- 0 High & Main St Unit T9505937
- 105 High St
- 102 A & B Northwest St
- 209 Main St
- 101 High St
- 204 Spring St
- 108 Northwest St
- 217 High St
- 118 Morristown St
- 115 Morristown St
- 110 Northwest St
- 164 Spring St
- 208 Spring St
- 120 Morristown St
Your Personal Tour Guide
Ask me questions while you tour the home.