116 E L St Chula Vista, CA 91911
Castle Park NeighborhoodEstimated Value: $681,000 - $738,943
About This Home
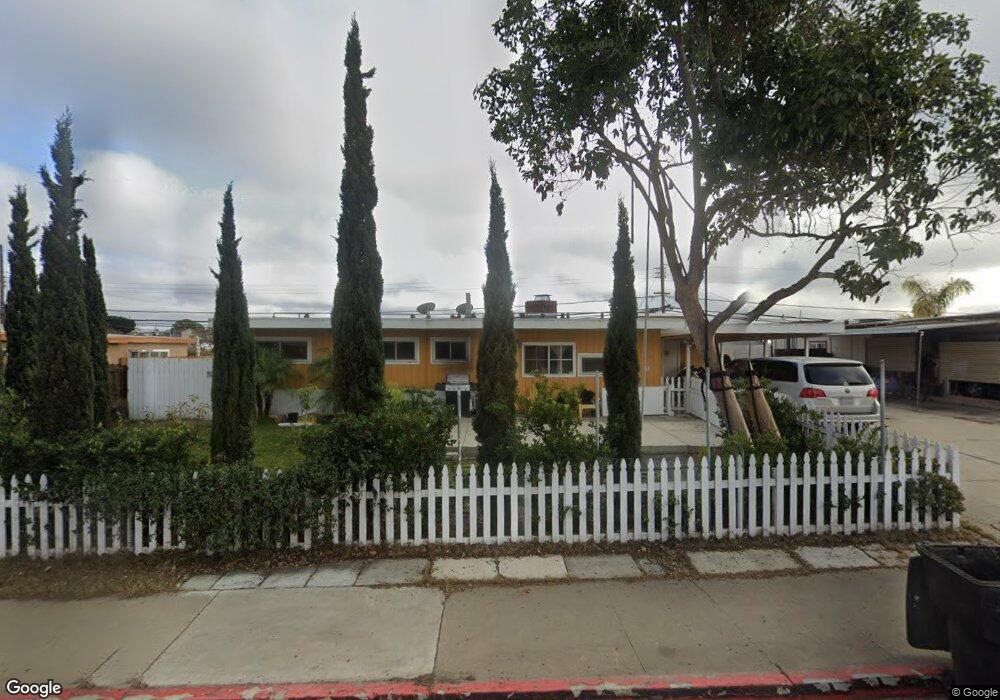
This home is located at 116 E L St, Chula Vista, CA 91911 and is currently estimated at $716,486, approximately $682 per square foot. 116 E L St is a home located in San Diego County with nearby schools including Cook Elementary School, Hilltop Middle School, and Hilltop Senior High School.
Ownership History
We collect this data history from publicly available records. To have your information removed, we recommend requesting removal directly through your county’s website.
Purchase Details
Home Financials for this Owner
Home Financials are based on the most recent Mortgage that was taken out on this home.Purchase Details
Purchase Details
Purchase Details
Home Values in the Area
Average Home Value in this Area
Purchase History
We collect this data history from publicly available records. To have your information removed, we recommend requesting removal directly through your county’s website.
| Date | Buyer | Sale Price | Title Company |
|---|---|---|---|
| $410,000 | Ticor Title San Diego | ||
| $255,000 | Wfg Title Company Of Ca | ||
| $301,364 | Accommodation | ||
| -- | -- |
Mortgage History
We collect this data history from publicly available records. To have your information removed, we recommend requesting removal directly through your county’s website.
| Date | Status | Borrower | Loan Amount |
|---|---|---|---|
| Open | $402,573 |
Tax History
We collect this data history from publicly available records. To have your information removed, we recommend requesting removal directly through your county’s website.
| Year | Tax Paid | Tax Assessment Tax Assessment Total Assessment is a certain percentage of the fair market value that is determined by local assessors to be the total taxable value of land and additions on the property. | Land | Improvement |
|---|---|---|---|---|
| 2025 | $5,487 | $475,833 | $417,807 | $58,026 |
| 2024 | $5,487 | $466,504 | $409,615 | $56,889 |
| 2023 | $5,412 | $457,358 | $401,584 | $55,774 |
| 2022 | $5,257 | $448,391 | $393,710 | $54,681 |
| 2021 | $5,136 | $439,600 | $385,991 | $53,609 |
| 2020 | $5,013 | $435,094 | $382,034 | $53,060 |
| 2019 | $4,884 | $426,564 | $374,544 | $52,020 |
| 2018 | $4,808 | $418,200 | $367,200 | $51,000 |
| 2017 | $3,103 | $269,340 | $179,560 | $89,780 |
| 2016 | $3,031 | $264,060 | $176,040 | $88,020 |
| 2015 | $2,988 | $260,094 | $173,396 | $86,698 |
| 2014 | $2,978 | $249,696 | $166,464 | $83,232 |
Map
- 71 E L St
- 64 E Donahoe St
- 133 Camino Entrada
- 141 E Millan St
- 29 L St
- 215 Camlau Dr Unit B
- 953 Maria Way
- 205 Camino Entrada
- 942 Monterey Ct
- 310 E Moss St
- 881 1st Ave
- 729 Myra Ave
- 202 E J St
- 687 Arthur Ave
- 37 E J St
- 305 Margo Ct
- 74 Vallecitos Way
- 86 E Emerson St
- 814 Tamayo Dr Unit 2
- 1165 Monserate Ave
Ask me questions while you tour the home.