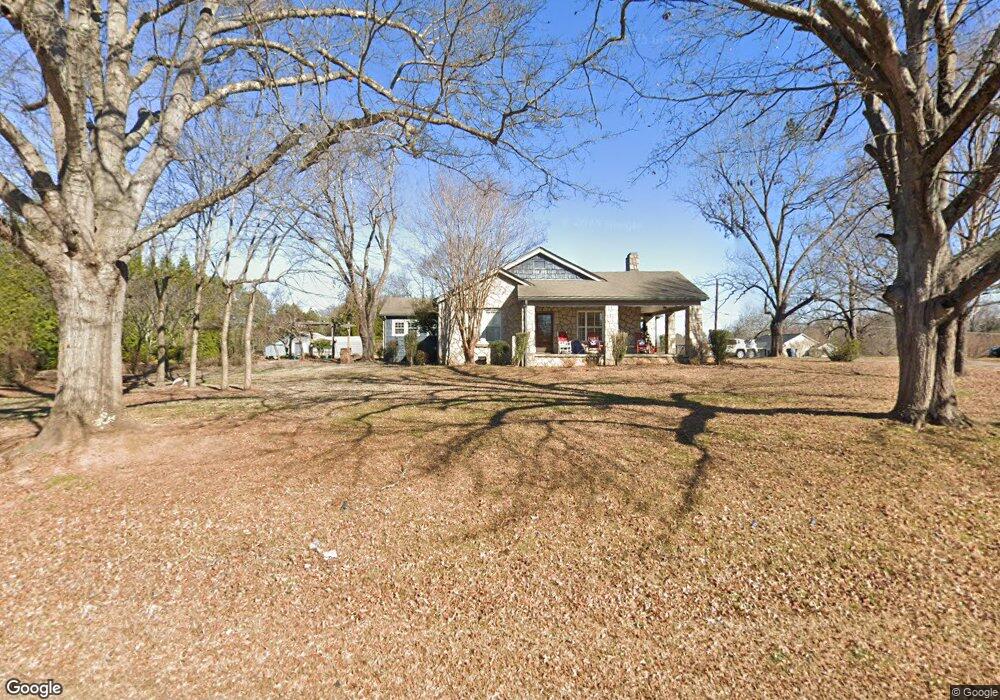
116 E Main St Duncan, SC 29334
Estimated Value: $211,172 - $282,000
3
Beds
1
Bath
1,752
Sq Ft
$144/Sq Ft
Est. Value
About This Home
This home is located at 116 E Main St, Duncan, SC 29334 and is currently estimated at $252,293, approximately $144 per square foot. 116 E Main St is a home located in Spartanburg County with nearby schools including Duncan Elementary School, Byrnes Freshman Academy, and Beech Springs Intermediate School.
Ownership History
Date
Name
Owned For
Owner Type
Purchase Details
Closed on
Jun 30, 2005
Sold by
Lindey James C
Bought by
Henerey Donald Keith and Henerey Tonda L
Current Estimated Value
Home Financials for this Owner
Home Financials are based on the most recent Mortgage that was taken out on this home.
Original Mortgage
$25,485
Interest Rate
5.98%
Mortgage Type
Credit Line Revolving
Create a Home Valuation Report for This Property
The Home Valuation Report is an in-depth analysis detailing your home's value as well as a comparison with similar homes in the area
Home Values in the Area
Average Home Value in this Area
Purchase History
| Date | Buyer | Sale Price | Title Company |
|---|---|---|---|
| Henerey Donald Keith | $169,900 | -- | |
| Henerey Donald Keith | $169,900 | -- |
Source: Public Records
Mortgage History
| Date | Status | Borrower | Loan Amount |
|---|---|---|---|
| Closed | Henerey Donald Keith | $25,485 | |
| Closed | Henerey Donald Keith | $135,900 |
Source: Public Records
Tax History
| Year | Tax Paid | Tax Assessment Tax Assessment Total Assessment is a certain percentage of the fair market value that is determined by local assessors to be the total taxable value of land and additions on the property. | Land | Improvement |
|---|---|---|---|---|
| 2022 | $906 | $3,619 | $573 | $3,046 |
| 2021 | $886 | $3,619 | $573 | $3,046 |
| 2020 | $872 | $3,619 | $573 | $3,046 |
| 2019 | $865 | $3,619 | $573 | $3,046 |
| 2018 | $823 | $3,619 | $573 | $3,046 |
| 2017 | $731 | $3,092 | $522 | $2,570 |
| 2016 | $708 | $3,092 | $522 | $2,570 |
| 2015 | $693 | $3,092 | $522 | $2,570 |
| 2014 | $686 | $3,092 | $522 | $2,570 |
Source: Public Records
Map
Nearby Homes
- 768 Cannonsburg Dr
- 224 Hotchkiss Ln
- 148 N Church St
- 000 S Church St
- 124 Lyman Ave
- 128 Lyman Ave
- 120 Lyman Ave
- 116 Johnson St
- 138 S Church St
- 170 Spartanburg Rd
- 3 Pacific St
- 142 Hughes St
- 26 Little St
- 5 Pacific St
- 290 Forest Lake Rd
- 296 Forest Lake Rd
- 100 Holly Dr
- 92 North St
- 101 Greer St
- 198 Spring St
Your Personal Tour Guide
Ask me questions while you tour the home.