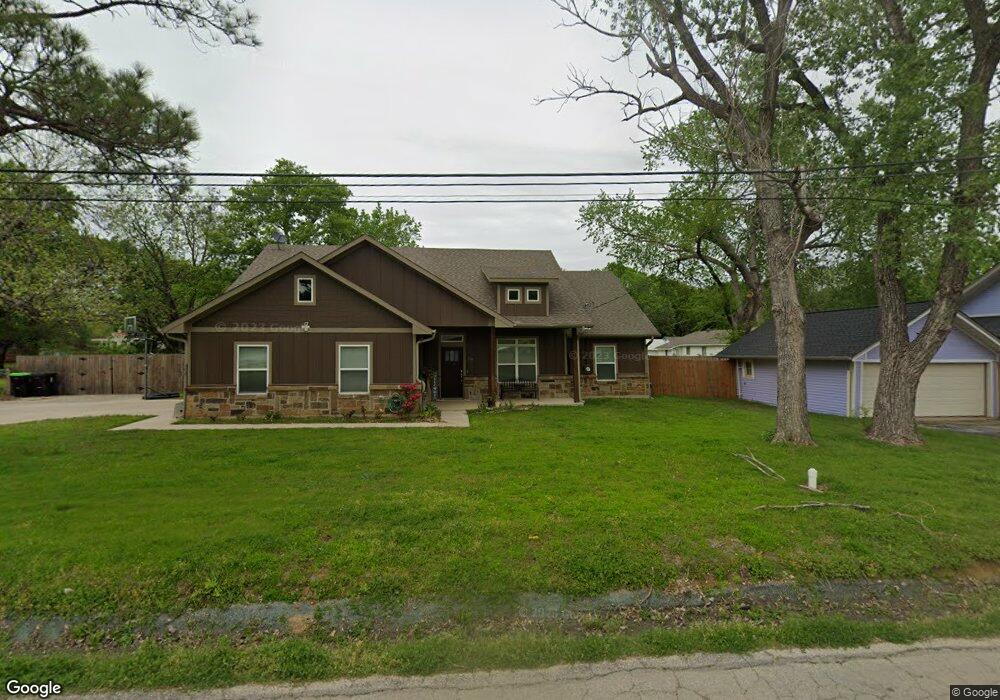
116 E Mckinney St Pilot Point, TX 76258
Estimated Value: $297,000 - $360,000
3
Beds
2
Baths
1,695
Sq Ft
$202/Sq Ft
Est. Value
About This Home
This home is located at 116 E Mckinney St, Pilot Point, TX 76258 and is currently estimated at $341,719, approximately $201 per square foot. 116 E Mckinney St is a home located in Denton County with nearby schools including Pilot Point Early Childhood Center, Pilot Point Elementary School, and Pilot Point Middle School.
Ownership History
Date
Name
Owned For
Owner Type
Purchase Details
Closed on
Jun 28, 2019
Sold by
Edgar Evans Custom Homes Inc
Bought by
Marmolejo Fernando and Marmolejo Brenda
Current Estimated Value
Home Financials for this Owner
Home Financials are based on the most recent Mortgage that was taken out on this home.
Original Mortgage
$259,000
Outstanding Balance
$227,740
Interest Rate
4%
Mortgage Type
New Conventional
Estimated Equity
$113,979
Create a Home Valuation Report for This Property
The Home Valuation Report is an in-depth analysis detailing your home's value as well as a comparison with similar homes in the area
Home Values in the Area
Average Home Value in this Area
Purchase History
| Date | Buyer | Sale Price | Title Company |
|---|---|---|---|
| Marmolejo Fernando | -- | Chicago Title |
Source: Public Records
Mortgage History
| Date | Status | Borrower | Loan Amount |
|---|---|---|---|
| Open | Marmolejo Fernando | $259,000 |
Source: Public Records
Tax History Compared to Growth
Tax History
| Year | Tax Paid | Tax Assessment Tax Assessment Total Assessment is a certain percentage of the fair market value that is determined by local assessors to be the total taxable value of land and additions on the property. | Land | Improvement |
|---|---|---|---|---|
| 2025 | $5,319 | $388,268 | $94,500 | $317,646 |
| 2024 | $6,354 | $352,971 | $0 | $0 |
| 2023 | $4,931 | $320,883 | $94,500 | $326,621 |
| 2022 | $5,998 | $291,712 | $77,000 | $274,835 |
| 2021 | $5,401 | $291,326 | $77,000 | $214,326 |
| 2020 | $4,945 | $237,975 | $37,800 | $200,175 |
| 2019 | $810 | $37,800 | $37,800 | $0 |
| 2018 | $2,863 | $131,947 | $34,300 | $97,647 |
| 2017 | $2,601 | $119,572 | $32,200 | $87,372 |
| 2016 | $2,466 | $113,364 | $31,698 | $81,666 |
| 2015 | $2,114 | $99,970 | $31,698 | $68,272 |
| 2013 | -- | $87,576 | $31,698 | $55,878 |
Source: Public Records
Map
Nearby Homes
- 516 S Church St
- 717 S Church St
- 400 S Washington St
- TBD W Clifton St
- 300 S Jefferson St
- 405 W Clifton St
- 301 E Division St
- 308 S Sherman St
- 510 S Irick St
- 511 S Irick St
- 1001 S Highway 377
- 317 E Liberty St
- 00 U S Route 377
- 504 S Kirby St
- 400 E Liberty St
- 515 E Liberty St
- 106 W Main St
- 517 S Kirby St
- 408 E Liberty St
- 326 W Liberty St
- 524 S Church St
- 516 S Church St
- 108 E Mckinney St
- 113 E Mckinney St
- 517 S Jefferson St
- 510 S Church St
- 601 S Jefferson St
- 117 E White St
- TBD Lot S Jefferson St
- TBD S Jefferson St
- 100 E Mckinney St
- 109 E Mckinney St
- 113 E White St
- 500 S Church St
- 609 S Jefferson St
- 101 E White St
- 517 S Church St
- 101 W Mckinney St
- 509 S Church St
- 610 S Church St