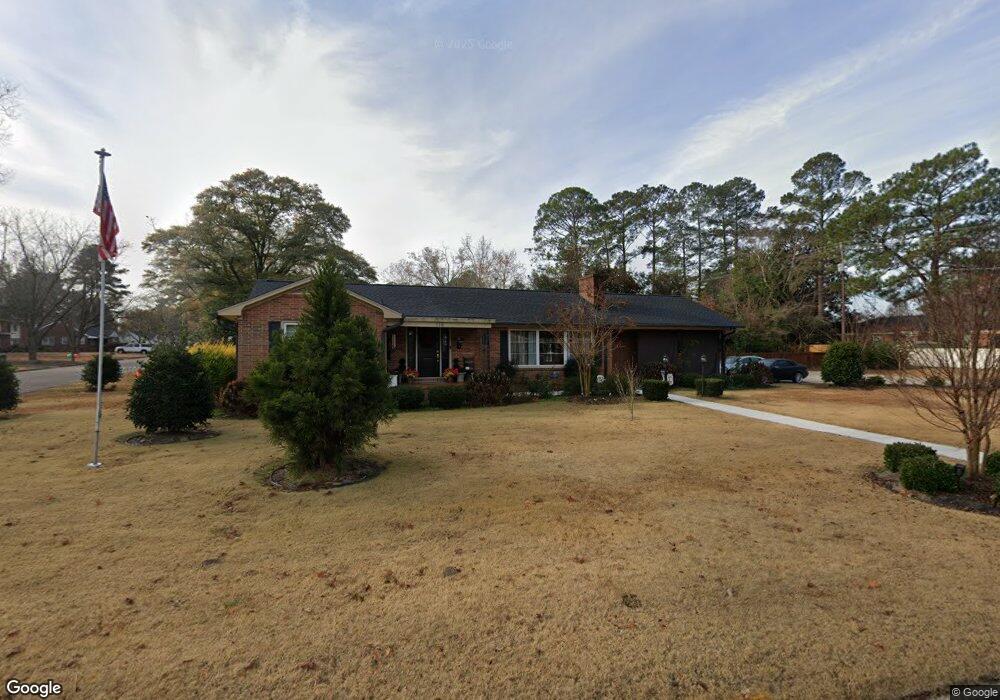
116 E Wellons St Smithfield, NC 27577
Estimated Value: $245,000 - $266,000
3
Beds
3
Baths
1,380
Sq Ft
$188/Sq Ft
Est. Value
About This Home
This home is located at 116 E Wellons St, Smithfield, NC 27577 and is currently estimated at $258,854, approximately $187 per square foot. 116 E Wellons St is a home located in Johnston County with nearby schools including South Smithfield Elementary School, Smithfield Middle School, and Smithfield-Selma High School.
Ownership History
Date
Name
Owned For
Owner Type
Purchase Details
Closed on
Jun 27, 2018
Sold by
Wilson James M
Bought by
Ellis Clarence Junior
Current Estimated Value
Purchase Details
Closed on
Jun 12, 2017
Sold by
Wilson James M
Bought by
Wilson James M and Langdon Family Trust
Purchase Details
Closed on
Apr 28, 2016
Sold by
Wilson James M
Bought by
Marita Wilson James M and Charlie Braxton Langdon Marital Trust
Purchase Details
Closed on
Oct 1, 2012
Sold by
Langdon Charlie Braxton and Langdon Dorothy P
Bought by
Langdon Charlie Braxton and Charlie Braxton Langdon Revocable Trust
Create a Home Valuation Report for This Property
The Home Valuation Report is an in-depth analysis detailing your home's value as well as a comparison with similar homes in the area
Home Values in the Area
Average Home Value in this Area
Purchase History
| Date | Buyer | Sale Price | Title Company |
|---|---|---|---|
| Ellis Clarence Junior | $155,000 | None Available | |
| Wilson James M | -- | None Available | |
| Marita Wilson James M | -- | None Available | |
| Langdon Charlie Braxton | -- | None Available |
Source: Public Records
Tax History
| Year | Tax Paid | Tax Assessment Tax Assessment Total Assessment is a certain percentage of the fair market value that is determined by local assessors to be the total taxable value of land and additions on the property. | Land | Improvement |
|---|---|---|---|---|
| 2025 | $1,844 | $235,090 | $80,000 | $155,090 |
| 2024 | $1,236 | $144,670 | $60,000 | $84,670 |
| 2023 | $1,256 | $144,670 | $60,000 | $84,670 |
| 2022 | $1,296 | $144,670 | $60,000 | $84,670 |
| 2021 | $1,296 | $144,670 | $60,000 | $84,670 |
| 2020 | $1,326 | $144,670 | $60,000 | $84,670 |
| 2019 | $1,326 | $144,670 | $60,000 | $84,670 |
| 2018 | $1,723 | $127,640 | $45,760 | $81,880 |
| 2017 | $1,723 | $127,640 | $45,760 | $81,880 |
| 2016 | $1,723 | $127,640 | $45,760 | $81,880 |
| 2015 | $1,723 | $127,640 | $45,760 | $81,880 |
| 2014 | $1,723 | $127,640 | $45,760 | $81,880 |
Source: Public Records
Map
Nearby Homes
Your Personal Tour Guide
Ask me questions while you tour the home.