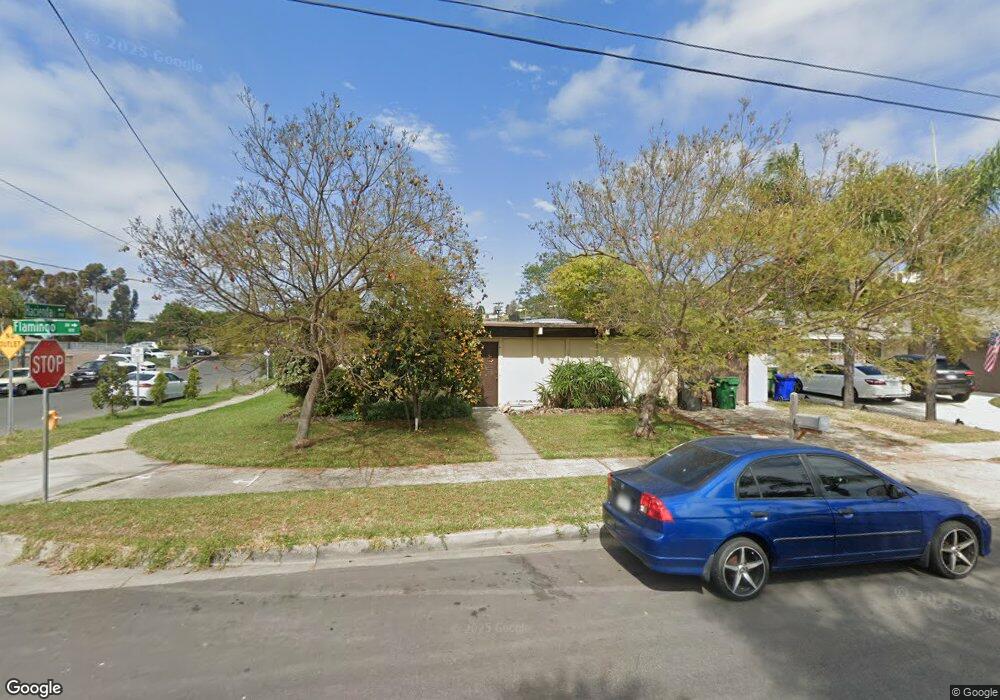
116 Flamingo Dr Oceanside, CA 92054
Loma Alta NeighborhoodEstimated Value: $756,864 - $931,000
3
Beds
2
Baths
1,288
Sq Ft
$656/Sq Ft
Est. Value
About This Home
This home is located at 116 Flamingo Dr, Oceanside, CA 92054 and is currently estimated at $845,466, approximately $656 per square foot. 116 Flamingo Dr is a home located in San Diego County with nearby schools including San Luis Rey Elementary School, Oceanside High School, and Scholarship Prep Oceanside.
Ownership History
Date
Name
Owned For
Owner Type
Purchase Details
Closed on
Jul 25, 2024
Sold by
Johnson Ann M
Bought by
Johnson Living Trust and Johnson
Current Estimated Value
Purchase Details
Closed on
Oct 5, 2005
Sold by
Anselmo John M and Anselmo Vila E
Bought by
Parra Angelica
Create a Home Valuation Report for This Property
The Home Valuation Report is an in-depth analysis detailing your home's value as well as a comparison with similar homes in the area
Home Values in the Area
Average Home Value in this Area
Purchase History
| Date | Buyer | Sale Price | Title Company |
|---|---|---|---|
| Johnson Living Trust | -- | None Listed On Document | |
| Parra Angelica | $440,000 | Chicago Title Company | |
| Parra Angelica | -- | Chicago Title Company |
Source: Public Records
Tax History
| Year | Tax Paid | Tax Assessment Tax Assessment Total Assessment is a certain percentage of the fair market value that is determined by local assessors to be the total taxable value of land and additions on the property. | Land | Improvement |
|---|---|---|---|---|
| 2025 | $4,656 | $427,225 | $275,163 | $152,062 |
| 2024 | $4,656 | $418,849 | $269,768 | $149,081 |
| 2023 | $4,511 | $410,637 | $264,479 | $146,158 |
| 2022 | $4,442 | $402,587 | $259,294 | $143,293 |
| 2021 | $4,458 | $394,694 | $254,210 | $140,484 |
| 2020 | $4,320 | $390,648 | $251,604 | $139,044 |
| 2019 | $4,193 | $382,989 | $246,671 | $136,318 |
| 2018 | $4,147 | $375,481 | $241,835 | $133,646 |
| 2017 | $3,868 | $350,000 | $245,000 | $105,000 |
| 2016 | $3,762 | $345,000 | $242,000 | $103,000 |
| 2015 | $3,437 | $320,000 | $225,000 | $95,000 |
| 2014 | $3,051 | $290,000 | $204,000 | $86,000 |
Source: Public Records
Map
Nearby Homes
- 0 Hacienda Dr Unit 1
- 3516 Las Vegas Dr
- 3430 Las Vegas Dr
- 3606 Vista Rey Unit 37
- 3606 Vista Rey
- 3660 Vista Campana N Unit 42
- 3660 Vista Campana N Unit 23
- 3410 Tonopah St
- 3625 Vista Oceana Unit 4
- 379 Honeysuckle Way
- Oceanpointe 1 Plan at OceanPointe
- Oceanpointe 3 Plan at OceanPointe
- Oceanpointe 3X Plan at OceanPointe
- Oceanpointe 3Y Plan at OceanPointe
- 375 Summer Breeze Way
- Oceanpointe 2 Plan at OceanPointe
- Oceanpointe 4 Plan at OceanPointe
- 309 Honeysuckle Way
- 361 Summer Breeze Way
- 354 Summer Breeze Way
- 118 Flamingo Dr
- 120 Flamingo Dr
- 3518 Hacienda Dr
- 3516 Hacienda Dr
- 117 Flamingo Dr
- 3514 Hacienda Dr
- 119 Flamingo Dr
- 122 Flamingo Dr
- 121 Flamingo Dr
- 3512 Hacienda Dr
- 3509 Hacienda Dr
- 124 Flamingo Dr
- 123 Flamingo Dr
- 3510 Hacienda Dr
- 3507 Hacienda Dr
- 125 Flamingo Dr
- 126 Flamingo Dr
- 3508 Mint Place
- 118 Riviera Dr
- 3508 Hacienda Dr