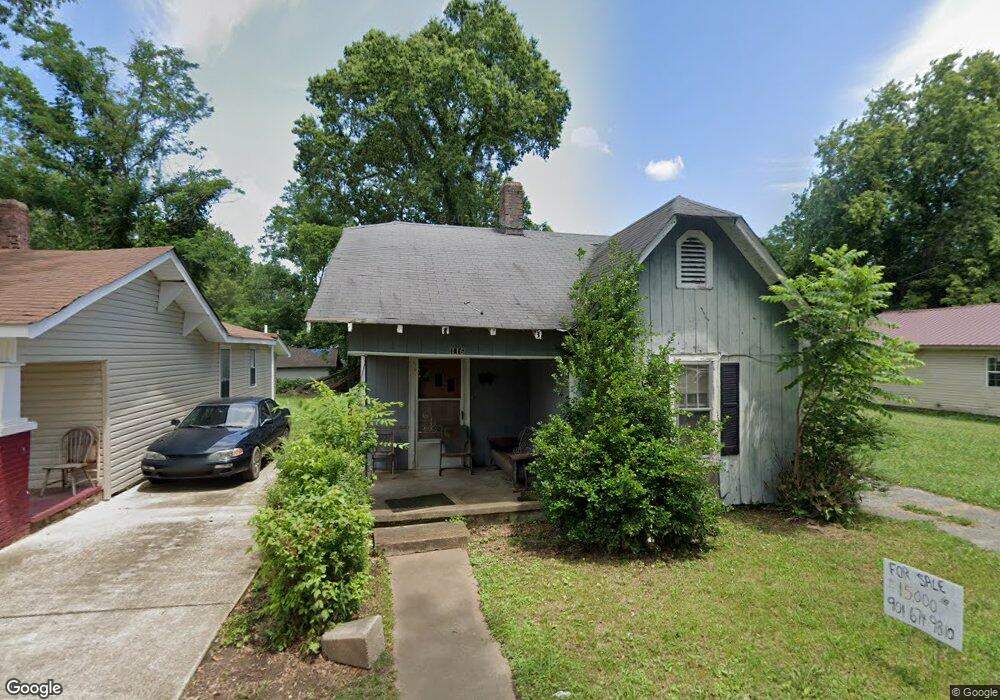
116 Logan St Jackson, TN 38301
Estimated Value: $42,927 - $75,000
Studio
1
Bath
1,216
Sq Ft
$53/Sq Ft
Est. Value
About This Home
This home is located at 116 Logan St, Jackson, TN 38301 and is currently estimated at $64,732, approximately $53 per square foot. 116 Logan St is a home located in Madison County with nearby schools including Lincoln Elementary School, North Parkway Middle School, and Liberty Technology Magnet High School.
Ownership History
Date
Name
Owned For
Owner Type
Purchase Details
Closed on
Feb 9, 2026
Sold by
Bond Abebreellis
Bought by
731Fuller Development Llc
Current Estimated Value
Purchase Details
Closed on
Sep 20, 2023
Sold by
Jj and Jj Einvestments
Bought by
Bond Abebreellis
Purchase Details
Closed on
Jan 23, 2023
Sold by
Chancery Court Of Madison County
Bought by
J J & E Investments
Purchase Details
Closed on
Nov 18, 2021
Sold by
Madison County Treasurer
Bought by
Rheasykes Annie Mae
Purchase Details
Closed on
Jan 1, 1985
Bought by
Sykes Annie Mae Rhea
Create a Home Valuation Report for This Property
The Home Valuation Report is an in-depth analysis detailing your home's value as well as a comparison with similar homes in the area
Purchase History
We collect this data history from publicly available records. To have your information removed, we recommend requesting removal directly through your county’s website.
| Date | Buyer | Sale Price | Title Company |
|---|---|---|---|
| 731Fuller Development Llc | -- | None Listed On Document | |
| Bond Abebreellis | $12,000 | None Listed On Document | |
| J J & E Investments | $10,511 | -- | |
| Rheasykes Annie Mae | $10,511 | None Listed On Document | |
| Sykes Annie Mae Rhea | -- | -- |
Source: Public Records
Tax History
| Year | Tax Paid | Tax Assessment Tax Assessment Total Assessment is a certain percentage of the fair market value that is determined by local assessors to be the total taxable value of land and additions on the property. | Land | Improvement |
|---|---|---|---|---|
| 2025 | $105 | $5,625 | $775 | $4,850 |
| 2024 | $105 | $5,625 | $775 | $4,850 |
| 2022 | $366 | $10,500 | $775 | $9,725 |
| 2021 | $294 | $6,825 | $700 | $6,125 |
| 2020 | $294 | $6,825 | $700 | $6,125 |
| 2019 | $294 | $6,825 | $700 | $6,125 |
| 2018 | $294 | $6,825 | $700 | $6,125 |
| 2017 | $346 | $7,825 | $700 | $7,125 |
| 2016 | $322 | $7,825 | $700 | $7,125 |
| 2015 | $322 | $7,825 | $700 | $7,125 |
| 2014 | $322 | $7,825 | $700 | $7,125 |
Source: Public Records
Map
Nearby Homes
Your Personal Tour Guide
Ask me questions while you tour the home.