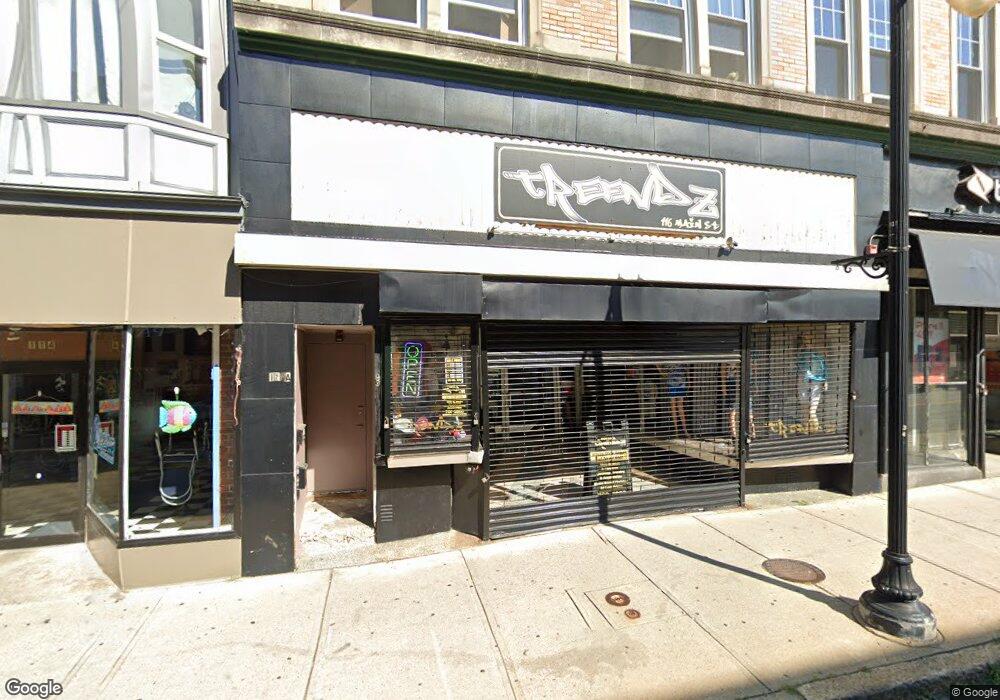
116 Main St Woonsocket, RI 02895
Downtown Woonsocket NeighborhoodEstimated Value: $323,741
Studio
--
Bath
16,762
Sq Ft
$19/Sq Ft
Est. Value
About This Home
This home is located at 116 Main St, Woonsocket, RI 02895 and is currently estimated at $323,741, approximately $19 per square foot. 116 Main St is a home located in Providence County with nearby schools including Woonsocket High School, Rise Prep Mayoral Academy Middle School, and Rise Prep Mayoral Academy.
Ownership History
Date
Name
Owned For
Owner Type
Purchase Details
Closed on
May 8, 2006
Sold by
1B Prop Holdings Llc
Bought by
Kang Steven
Current Estimated Value
Home Financials for this Owner
Home Financials are based on the most recent Mortgage that was taken out on this home.
Original Mortgage
$171,000
Outstanding Balance
$97,610
Interest Rate
6.34%
Mortgage Type
Commercial
Estimated Equity
$226,131
Create a Home Valuation Report for This Property
The Home Valuation Report is an in-depth analysis detailing your home's value as well as a comparison with similar homes in the area
Home Values in the Area
Average Home Value in this Area
Purchase History
| Date | Buyer | Sale Price | Title Company |
|---|---|---|---|
| Kang Steven | $190,000 | -- | |
| Kang Steven | $190,000 | -- |
Source: Public Records
Mortgage History
| Date | Status | Borrower | Loan Amount |
|---|---|---|---|
| Open | Kang Steven | $171,000 | |
| Closed | Kang Steven | $171,000 |
Source: Public Records
Tax History
| Year | Tax Paid | Tax Assessment Tax Assessment Total Assessment is a certain percentage of the fair market value that is determined by local assessors to be the total taxable value of land and additions on the property. | Land | Improvement |
|---|---|---|---|---|
| 2025 | $6,420 | $301,400 | $46,800 | $254,600 |
| 2024 | $7,298 | $270,500 | $39,000 | $231,500 |
| 2023 | $7,017 | $270,500 | $39,000 | $231,500 |
| 2022 | $7,017 | $270,500 | $39,000 | $231,500 |
| 2021 | $9,292 | $267,400 | $28,700 | $238,700 |
| 2020 | $9,423 | $267,400 | $28,700 | $238,700 |
| 2018 | $9,677 | $267,400 | $28,700 | $238,700 |
| 2017 | $8,339 | $225,800 | $32,400 | $193,400 |
| 2016 | $8,657 | $225,800 | $32,400 | $193,400 |
| 2015 | $9,190 | $225,800 | $32,400 | $193,400 |
| 2014 | $7,574 | $189,400 | $36,000 | $153,400 |
Source: Public Records
Map
Nearby Homes
- 99 Allen St Unit 205
- 180 Allen St Unit 104
- 115 Railroad St
- 379 Front St
- 35 Greene St
- 0 N Main St Unit 1401765
- 233 Grove St
- 36 Fairmount St
- 70 W Park Place
- 58 Oakley Rd
- 526 Bernon St
- 24 Paradis Ave
- 0 Holbrook Ln Unit 1402850
- 122 Grand St
- 59 Division St
- 190 Crawford St
- 74 Maple St
- 15 Knight St
- 219 Crawford St
- 308 Harris Ave
- 118 Main St
- 92 Main St
- 29 Ascension St
- 108 Main St
- 114 Main St Unit 1A
- 114 Main St
- 122 Main St
- 112 Main St Unit 114
- 106 Main St
- 106 Main St Unit Retail
- 65 Confidential
- 128 Main St
- 130 Main St
- 93 Main St
- 87 Main St
- 111 Main St
- 100 Address Withheld St
- 0 Blanche St Unit 1241257
- 0 St Nichols St Unit 1303589
- 170 Main St
Your Personal Tour Guide
Ask me questions while you tour the home.