Estimated Value: $196,000 - $234,000
3
Beds
1
Bath
1,378
Sq Ft
$155/Sq Ft
Est. Value
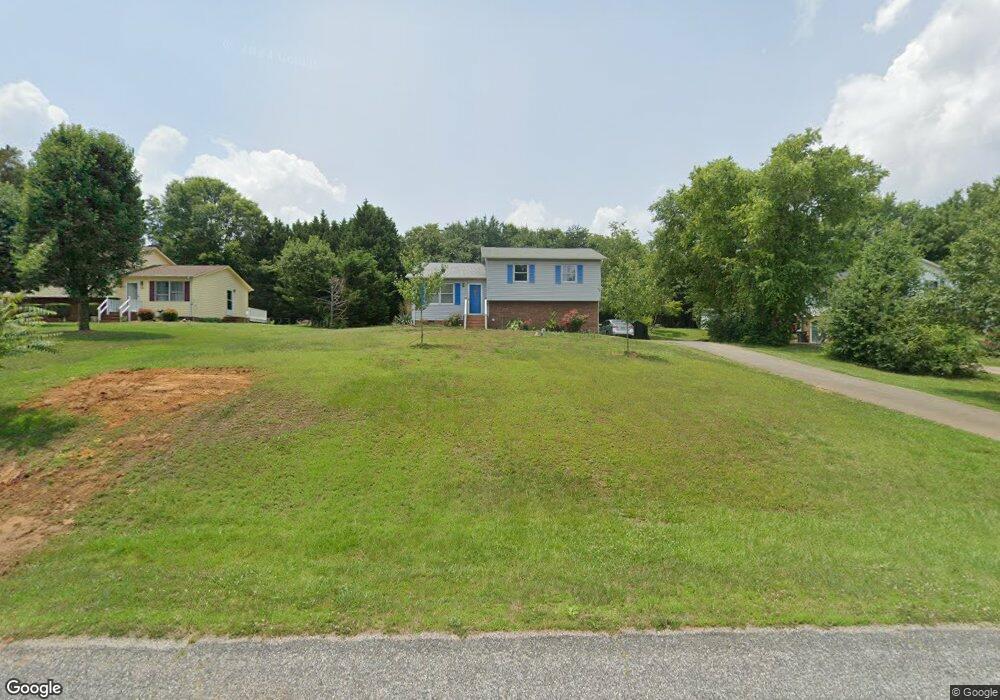
About This Home
This home is located at 116 Maple Ridge Dr, King, NC 27021 and is currently estimated at $214,047, approximately $155 per square foot. 116 Maple Ridge Dr is a home located in Stokes County with nearby schools including Poplar Springs Elementary School, Chestnut Grove Middle, and South Stokes High.
Ownership History
Date
Name
Owned For
Owner Type
Purchase Details
Closed on
Aug 20, 2012
Sold by
Melendez Rafael Alfonso and Guardado Marta Edy
Bought by
Melendez Rafael Alfonso and Guardado Marta Edy
Current Estimated Value
Home Financials for this Owner
Home Financials are based on the most recent Mortgage that was taken out on this home.
Original Mortgage
$96,527
Outstanding Balance
$38,564
Interest Rate
4%
Mortgage Type
New Conventional
Estimated Equity
$175,483
Purchase Details
Closed on
Aug 30, 2007
Sold by
Lookabill Richard A and Lookabill Abbie L
Bought by
Melendez Rafael Alfonso and Guardado Melendez Marta Edy
Home Financials for this Owner
Home Financials are based on the most recent Mortgage that was taken out on this home.
Original Mortgage
$99,750
Interest Rate
6.7%
Mortgage Type
New Conventional
Create a Home Valuation Report for This Property
The Home Valuation Report is an in-depth analysis detailing your home's value as well as a comparison with similar homes in the area
Home Values in the Area
Average Home Value in this Area
Purchase History
| Date | Buyer | Sale Price | Title Company |
|---|---|---|---|
| Melendez Rafael Alfonso | -- | Servicelink | |
| Melendez Rafael Alfonso | $105,000 | None Available |
Source: Public Records
Mortgage History
| Date | Status | Borrower | Loan Amount |
|---|---|---|---|
| Open | Melendez Rafael Alfonso | $96,527 | |
| Closed | Melendez Rafael Alfonso | $99,750 |
Source: Public Records
Tax History
| Year | Tax Paid | Tax Assessment Tax Assessment Total Assessment is a certain percentage of the fair market value that is determined by local assessors to be the total taxable value of land and additions on the property. | Land | Improvement |
|---|---|---|---|---|
| 2025 | $1,210 | $169,200 | $35,000 | $134,200 |
| 2024 | $1,210 | $118,600 | $28,000 | $90,600 |
| 2023 | $961 | $118,600 | $28,000 | $90,600 |
| 2022 | $878 | $118,600 | $28,000 | $90,600 |
| 2021 | $878 | $118,600 | $28,000 | $90,600 |
| 2020 | $749 | $101,200 | $22,500 | $78,700 |
| 2019 | $749 | $101,200 | $22,500 | $78,700 |
| 2018 | $749 | $101,200 | $22,500 | $78,700 |
| 2017 | $744 | $101,200 | $22,500 | $78,700 |
| 2016 | $719 | $97,800 | $22,500 | $75,300 |
| 2015 | $714 | $97,800 | $22,500 | $75,300 |
| 2014 | $735 | $97,800 | $22,500 | $75,300 |
Source: Public Records
Map
Nearby Homes
- 112 Rocky Maple Dr Unit Lot 41
- 117 Rocky Maple Dr
- Lot 18 Glen Brooke Ln
- 2595 Slate Rd
- Lot 19 Glen Brooke Ln
- 925 Mountainview Rd
- 0 Oak Brooke Dr
- 218 Maverick Trail Dr
- 119 Red Leaf Dr
- CALI Plan at High Meadows
- Kyle Plan at High Meadows
- Penwell Plan at High Meadows
- Hayden Plan at High Meadows
- 225 Maverick Trail Dr
- 109 Glen Brooke Ln
- 149 Helsabeck Rd
- 1255 Mountain View Rd
- 104 Palomino Dr
- 208 Mountain View Rd
- 0 Mountain View Rd Unit 1173137
- 120 Maple Ridge Dr
- 112 Maple Ridge Dr
- 104 Maple Ridge Dr
- 165 Maple Ridge Dr
- 124 Maple Ridge Dr
- 117 Rocky Maple Dr Unit Lot 49
- 117 Maple Ridge Dr
- 113 Maple Ridge Dr
- 121 Maple Ridge Dr
- 128 Maple Ridge Dr
- 109 Maple Ridge Dr
- 125 Maple Ridge Dr
- 105 Maple Ridge Dr
- 132 Maple Ridge Dr
- 129 Maple Ridge Dr
- 101 Maple Ridge Dr
- 122 Marie Dr
- 118 Marie Dr
- 126 Marie Dr
- 114 Marie Dr