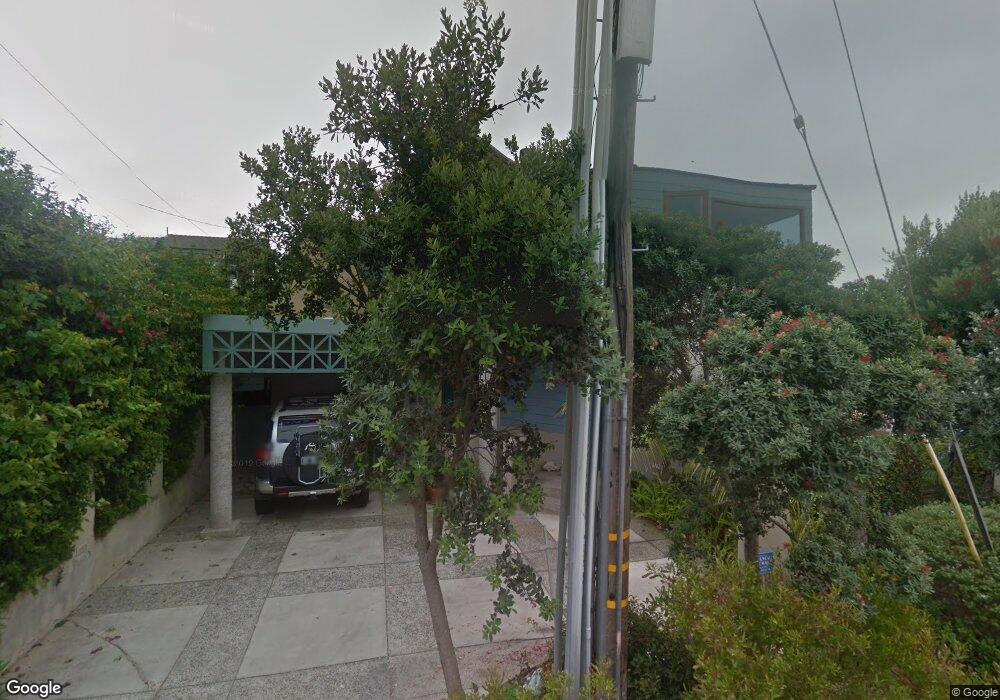
116 Melanie Way Del Mar, CA 92014
Estimated Value: $2,382,000 - $3,293,830
3
Beds
3
Baths
2,069
Sq Ft
$1,343/Sq Ft
Est. Value
About This Home
This home is located at 116 Melanie Way, Del Mar, CA 92014 and is currently estimated at $2,779,277, approximately $1,343 per square foot. 116 Melanie Way is a home located in San Diego County with nearby schools including Del Mar Heights School, Del Mar Hills Elementary School, and Earl Warren Middle School.
Ownership History
Date
Name
Owned For
Owner Type
Purchase Details
Closed on
Apr 21, 2020
Sold by
Grindle Thomas L
Bought by
Grindle Thomaas L
Current Estimated Value
Home Financials for this Owner
Home Financials are based on the most recent Mortgage that was taken out on this home.
Original Mortgage
$510,400
Outstanding Balance
$450,426
Interest Rate
3.2%
Mortgage Type
New Conventional
Estimated Equity
$2,328,851
Purchase Details
Closed on
Mar 21, 2020
Sold by
Grindle Thomas L
Bought by
Grindle Thomaas L
Home Financials for this Owner
Home Financials are based on the most recent Mortgage that was taken out on this home.
Original Mortgage
$510,400
Outstanding Balance
$450,426
Interest Rate
3.2%
Mortgage Type
New Conventional
Estimated Equity
$2,328,851
Purchase Details
Closed on
Feb 5, 2009
Sold by
Grindle Thomas L and Grindle Jerri G
Bought by
Grindle Thomas L and Grindle Jerri G
Home Financials for this Owner
Home Financials are based on the most recent Mortgage that was taken out on this home.
Original Mortgage
$345,000
Interest Rate
5.08%
Mortgage Type
New Conventional
Purchase Details
Closed on
May 25, 1990
Create a Home Valuation Report for This Property
The Home Valuation Report is an in-depth analysis detailing your home's value as well as a comparison with similar homes in the area
Home Values in the Area
Average Home Value in this Area
Purchase History
| Date | Buyer | Sale Price | Title Company |
|---|---|---|---|
| Grindle Thomaas L | -- | None Available | |
| Grindle Thomas L | -- | Lawyers Title | |
| Grindle Thomaas L | -- | None Available | |
| Grindle Thomas L | -- | Lawyers Title | |
| Grindle Thomas L | -- | Chicago Title Company | |
| Grindle Thomas L | -- | Chicago Title Company | |
| -- | $671,800 | -- |
Source: Public Records
Mortgage History
| Date | Status | Borrower | Loan Amount |
|---|---|---|---|
| Open | Grindle Thomas L | $510,400 | |
| Closed | Grindle Thomas L | $510,400 | |
| Closed | Grindle Thomas L | $345,000 |
Source: Public Records
Tax History Compared to Growth
Tax History
| Year | Tax Paid | Tax Assessment Tax Assessment Total Assessment is a certain percentage of the fair market value that is determined by local assessors to be the total taxable value of land and additions on the property. | Land | Improvement |
|---|---|---|---|---|
| 2025 | $12,933 | $1,239,260 | $864,693 | $374,567 |
| 2024 | $12,933 | $1,214,962 | $847,739 | $367,223 |
| 2023 | $12,647 | $1,191,140 | $831,117 | $360,023 |
| 2022 | $12,442 | $1,167,785 | $814,821 | $352,964 |
| 2021 | $11,981 | $1,144,889 | $798,845 | $346,044 |
| 2020 | $12,087 | $1,133,150 | $790,654 | $342,496 |
| 2019 | $11,848 | $1,110,932 | $775,151 | $335,781 |
| 2018 | $11,322 | $1,089,150 | $759,952 | $329,198 |
| 2017 | $11,107 | $1,067,795 | $745,051 | $322,744 |
| 2016 | $10,742 | $1,046,859 | $730,443 | $316,416 |
| 2015 | $10,580 | $1,031,136 | $719,472 | $311,664 |
| 2014 | $10,360 | $1,010,938 | $705,379 | $305,559 |
Source: Public Records
Map
Nearby Homes
- 931 - 939 Ocean Ave
- 119 10th St
- 1141 Luneta Dr
- 914 Highland Ave
- 531 Camino Del Mar
- 1407 Ocean Ave
- 555 Amphitheatre Dr
- 550 Amphitheatre Dr
- 386 13th St
- 14014 Rue d Antibes
- 00000 Hidden Pines
- 1552 Camino Del Mar Unit 401
- 2122 Del Mar Heights Rd
- 722 Amphitheatre Dr
- 1562 Camino Del Mar Unit 648
- 1641 Stratford Way
- 13765 Condesa Dr
- 13730 Condesa Dr
- 1716 Ocean Front
- 1722 Seaview Ave
- 114 9th St
- 120 9th St
- 106 9th St
- 128 9th St
- 138 9th St Unit U2
- 134 9th St
- 113 10th St
- 111 10th St
- 113B W 9th St Unit 6
- 931 Ocean Ave Unit 39
- 142 Melanie Way
- 129 10th St Unit 31
- 113 9th St Unit n/a
- 113 9th St
- 0 9th St Unit 190020054
- 154 9th St
- 156 Melanie Way Unit 2
- 9th Street Unit N/A
- 9th 9th St
- 9th 25th St