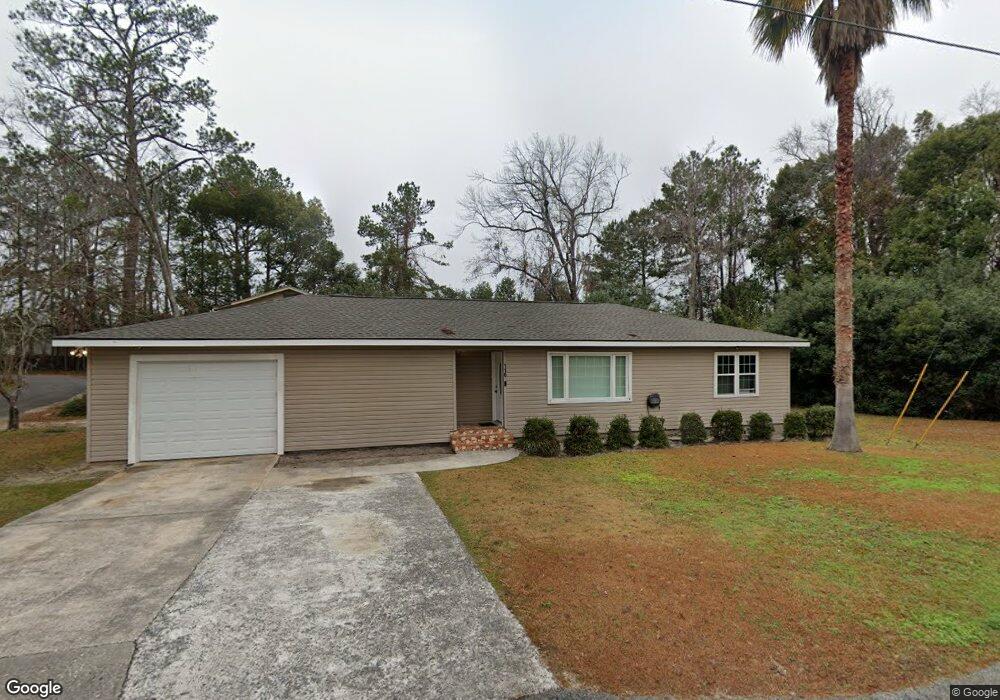
116 Moss Oak Dr Valdosta, GA 31601
Estimated Value: $114,000 - $187,000
--
Bed
1
Bath
1,438
Sq Ft
$102/Sq Ft
Est. Value
About This Home
This home is located at 116 Moss Oak Dr, Valdosta, GA 31601 and is currently estimated at $146,246, approximately $101 per square foot. 116 Moss Oak Dr is a home located in Lowndes County with nearby schools including S.L. Mason Elementary School, Valdosta Middle School, and Valdosta High School.
Ownership History
Date
Name
Owned For
Owner Type
Purchase Details
Closed on
Dec 28, 2005
Sold by
Jones George Randall
Bought by
Harrell Antonyio
Current Estimated Value
Home Financials for this Owner
Home Financials are based on the most recent Mortgage that was taken out on this home.
Original Mortgage
$70,000
Outstanding Balance
$40,454
Interest Rate
6.75%
Mortgage Type
New Conventional
Estimated Equity
$105,792
Purchase Details
Closed on
Jan 16, 1998
Bought by
Jones George Randall
Purchase Details
Closed on
Nov 4, 1997
Bought by
Valdosta Bank & Trust
Purchase Details
Closed on
May 31, 1995
Bought by
Winnie Allen C
Purchase Details
Closed on
Jan 27, 1989
Bought by
Bonner Bobby M and Bonner Lyn
Purchase Details
Closed on
Aug 4, 1988
Bought by
Hughes Linda S Etal
Purchase Details
Closed on
Sep 24, 1966
Bought by
Bonner Geraldine Hall
Purchase Details
Closed on
Sep 10, 1966
Bought by
Bonner Geraldine Hall
Create a Home Valuation Report for This Property
The Home Valuation Report is an in-depth analysis detailing your home's value as well as a comparison with similar homes in the area
Home Values in the Area
Average Home Value in this Area
Purchase History
| Date | Buyer | Sale Price | Title Company |
|---|---|---|---|
| Harrell Antonyio | $90,000 | -- | |
| Jones George Randall | $50,000 | -- | |
| Valdosta Bank & Trust | -- | -- | |
| Winnie Allen C | $43,500 | -- | |
| Bonner Bobby M | -- | -- | |
| Hughes Linda S Etal | -- | -- | |
| Bonner Geraldine Hall | -- | -- | |
| Bonner Geraldine Hall | -- | -- |
Source: Public Records
Mortgage History
| Date | Status | Borrower | Loan Amount |
|---|---|---|---|
| Open | Harrell Antonyio | $70,000 | |
| Closed | Harrell Antonyio | $20,000 |
Source: Public Records
Tax History Compared to Growth
Tax History
| Year | Tax Paid | Tax Assessment Tax Assessment Total Assessment is a certain percentage of the fair market value that is determined by local assessors to be the total taxable value of land and additions on the property. | Land | Improvement |
|---|---|---|---|---|
| 2024 | $1,302 | $52,611 | $3,877 | $48,734 |
| 2023 | $1,302 | $48,939 | $3,877 | $45,062 |
| 2022 | $1,110 | $38,835 | $3,877 | $34,958 |
| 2021 | $1,142 | $38,835 | $3,877 | $34,958 |
| 2020 | $1,166 | $38,835 | $3,877 | $34,958 |
| 2019 | $1,166 | $38,835 | $3,877 | $34,958 |
| 2018 | $1,181 | $38,835 | $3,877 | $34,958 |
| 2017 | $1,189 | $38,835 | $3,877 | $34,958 |
| 2016 | $1,187 | $38,835 | $3,877 | $34,958 |
| 2015 | -- | $38,835 | $3,877 | $34,958 |
| 2014 | $1,108 | $38,835 | $3,877 | $34,958 |
Source: Public Records
Map
Nearby Homes
- TBD Moss Oak Dr
- 316 Blitch St
- 230 Saint Augustine Rd
- 303 Nan St
- 219 N St Augustine Rd
- 1202 Melissa Dr
- 1400 Lankford Dr
- 203 N Saint Augustine Rd
- 503 Roberts St
- 211 Stella St
- 107 Jordan St
- 605 N Saint Augustine Rd
- 201 Norman Dr
- 614 Lamar St
- 1522 Woodard St
- 1114 Clark St
- 1501 Harmon Dr
- 820 W Gordon St
- 1815 W Hill Ave
- 2103 W Hill Ave
- 112 Dogwood Dr
- 1525 Weaver Dr
- 1523 Weaver Dr
- 1527 Weaver Dr
- 1521 Weaver Dr
- 1529 Weaver Dr
- 1531 Weaver Dr
- 503 Weaver St
- 112 Moss Oak Dr
- 1533 Weaver Dr
- 113 Dogwood Dr
- 108 Dogwood Dr
- 109 Hyde Park Ave
- 1535 Weaver Dr
- 1524 Weaver Dr
- 1526 Weaver Dr
- 111 Dogwood Dr
- 1528 Weaver Dr
- 1522 Weaver Dr
- 109 Holloway Dr