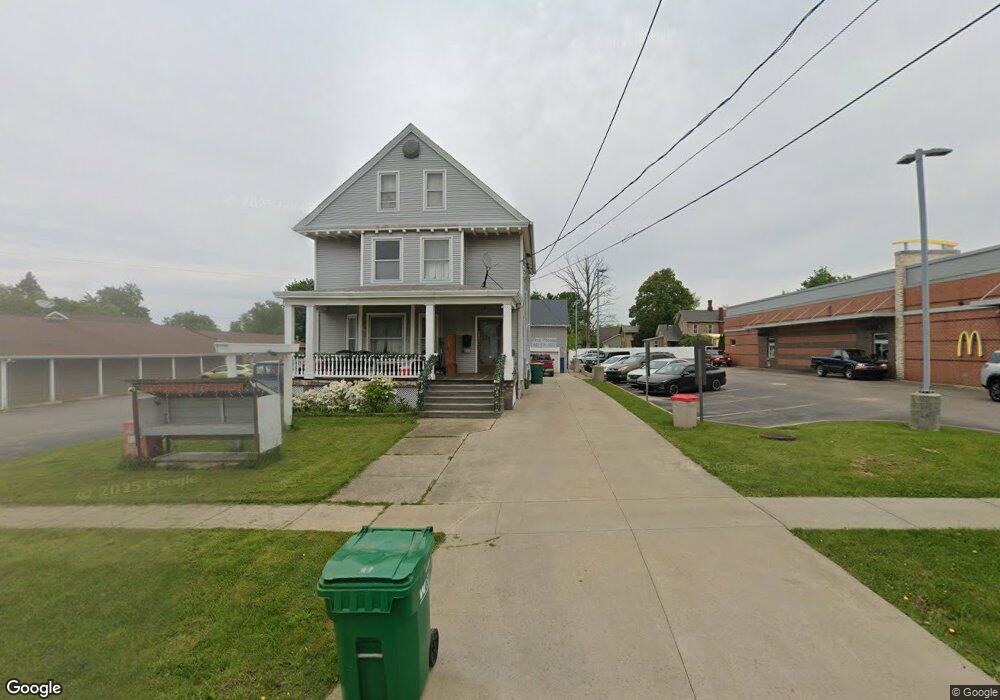
116 N Chestnut St Jefferson, OH 44047
Estimated Value: $53,000 - $177,656
4
Beds
2
Baths
1,981
Sq Ft
$68/Sq Ft
Est. Value
About This Home
This home is located at 116 N Chestnut St, Jefferson, OH 44047 and is currently estimated at $134,414, approximately $67 per square foot. 116 N Chestnut St is a home located in Ashtabula County with nearby schools including Jefferson Elementary School, Jefferson Area Junior High School, and Jefferson Area Senior High School.
Ownership History
Date
Name
Owned For
Owner Type
Purchase Details
Closed on
Mar 3, 2025
Sold by
Midfirst Bank
Bought by
Lin Xiuyu
Current Estimated Value
Purchase Details
Closed on
Oct 16, 2024
Sold by
Mook Dorrance E
Bought by
Midfirst Bank
Purchase Details
Closed on
Mar 5, 2019
Sold by
Mendrala Brian
Bought by
Mook Dorrance E
Purchase Details
Closed on
Aug 8, 2018
Sold by
Mook Dorrance E and Mendrala Brian
Bought by
Mook Dorrance E and Mendrala Brian
Purchase Details
Closed on
Nov 3, 2017
Sold by
Rice Daniel E
Bought by
Mook Dorrance E and Mendrala Brian
Home Financials for this Owner
Home Financials are based on the most recent Mortgage that was taken out on this home.
Original Mortgage
$74,623
Interest Rate
4.5%
Mortgage Type
FHA
Purchase Details
Closed on
Jul 25, 1994
Sold by
Noxon Harlen L
Bought by
Rice Daniel E and Rice Linda J
Home Financials for this Owner
Home Financials are based on the most recent Mortgage that was taken out on this home.
Original Mortgage
$25,600
Interest Rate
8.5%
Mortgage Type
New Conventional
Create a Home Valuation Report for This Property
The Home Valuation Report is an in-depth analysis detailing your home's value as well as a comparison with similar homes in the area
Home Values in the Area
Average Home Value in this Area
Purchase History
| Date | Buyer | Sale Price | Title Company |
|---|---|---|---|
| Lin Xiuyu | $48,000 | Vylla Title | |
| Lin Xiuyu | $48,000 | Vylla Title | |
| Midfirst Bank | $90,421 | None Listed On Document | |
| Midfirst Bank | $90,421 | None Listed On Document | |
| Mook Dorrance E | $25,000 | None Available | |
| Mook Dorrance E | -- | None Available | |
| Mook Dorrance E | $76,000 | Chicago Title | |
| Rice Daniel E | $32,000 | -- |
Source: Public Records
Mortgage History
| Date | Status | Borrower | Loan Amount |
|---|---|---|---|
| Previous Owner | Mook Dorrance E | $74,623 | |
| Previous Owner | Rice Daniel E | $25,600 |
Source: Public Records
Tax History
| Year | Tax Paid | Tax Assessment Tax Assessment Total Assessment is a certain percentage of the fair market value that is determined by local assessors to be the total taxable value of land and additions on the property. | Land | Improvement |
|---|---|---|---|---|
| 2024 | $3,604 | $41,410 | $14,740 | $26,670 |
| 2023 | $2,930 | $41,410 | $14,740 | $26,670 |
| 2022 | $2,056 | $30,380 | $11,340 | $19,040 |
| 2021 | $2,229 | $30,380 | $11,340 | $19,040 |
| 2020 | $1,522 | $30,380 | $11,340 | $19,040 |
| 2019 | $837 | $16,140 | $5,150 | $10,990 |
| 2018 | $813 | $16,140 | $5,150 | $10,990 |
| 2017 | $833 | $16,560 | $5,570 | $10,990 |
| 2016 | $846 | $16,450 | $5,530 | $10,920 |
| 2015 | $1,714 | $16,450 | $5,530 | $10,920 |
| 2014 | $2,997 | $16,450 | $5,530 | $10,920 |
| 2013 | $1,981 | $34,300 | $22,610 | $11,690 |
Source: Public Records
Map
Nearby Homes
- 68 E Ashtabula St
- 2234 Ohio 307
- 850 State Route 46 N
- 0 Vl St Rt 307
- 242 Jackson St
- 243 Jackson St
- 138 E Cedar St
- 187 Garfield Ln
- 304 Woodland Way
- 309 Woodland Way Unit A
- 800 Lenox New Lyme Rd
- 425 Woodside Ave
- 0 State Route 307 Unit 5168871
- 0 State Route 307 Unit LotWP001
- 1749 Black Sea Rd
- 0000 Black Sea Rd
- 2254 Chapel Rd
- 2631 State Route 46 N
- 1592 Brown Rd
- 2977 Ohio 307
- 117 N Chestnut St
- 104 N Chestnut St
- 132 N Chestnut St
- 131 N Chestnut St
- 1409 Ohio 46
- VL Ohio 46
- 2242 Ohio 46
- 11, 17 W Walnut St
- 21 E Walnut St
- 11 W Walnut St
- 113 Center St
- 121 Center St
- 127 Center St
- 96 N Chestnut St
- 139 N Chestnut St
- 25 E Walnut St
- 131 Center St
- 17 W Walnut St
- 12 E Walnut St
- 16 E Ashtabula St
Your Personal Tour Guide
Ask me questions while you tour the home.