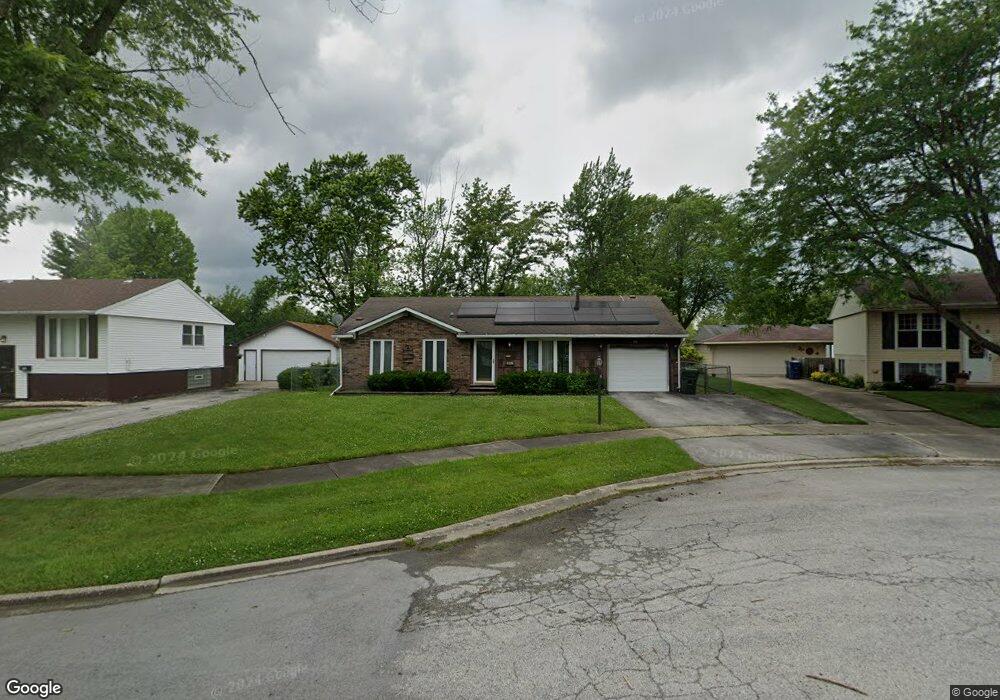
116 N Elm Ln Glenwood, IL 60425
Estimated Value: $162,000 - $200,000
3
Beds
2
Baths
965
Sq Ft
$189/Sq Ft
Est. Value
About This Home
This home is located at 116 N Elm Ln, Glenwood, IL 60425 and is currently estimated at $182,496, approximately $189 per square foot. 116 N Elm Ln is a home located in Cook County with nearby schools including Brookwood Middle School, Hickory Bend Elementary School, and Brookwood Jr High School.
Ownership History
Date
Name
Owned For
Owner Type
Purchase Details
Closed on
May 28, 2010
Sold by
Zaffino Ron
Bought by
Gates Eloise M
Current Estimated Value
Home Financials for this Owner
Home Financials are based on the most recent Mortgage that was taken out on this home.
Original Mortgage
$86,310
Outstanding Balance
$58,634
Interest Rate
5.25%
Mortgage Type
FHA
Estimated Equity
$123,862
Purchase Details
Closed on
Jan 29, 2010
Sold by
Secretary Of Housing & Urban Development
Bought by
Zaffino Ron
Purchase Details
Closed on
Mar 10, 2009
Sold by
Bullock Walter L
Bought by
Secretary Of Housing & Urban Development
Purchase Details
Closed on
Dec 22, 2004
Sold by
Zwolinski Nicholas J and Zwolinski Julie A
Bought by
Bullock Walter L
Home Financials for this Owner
Home Financials are based on the most recent Mortgage that was taken out on this home.
Original Mortgage
$129,209
Interest Rate
5.83%
Mortgage Type
FHA
Create a Home Valuation Report for This Property
The Home Valuation Report is an in-depth analysis detailing your home's value as well as a comparison with similar homes in the area
Home Values in the Area
Average Home Value in this Area
Purchase History
| Date | Buyer | Sale Price | Title Company |
|---|---|---|---|
| Gates Eloise M | $87,500 | First American Title | |
| Zaffino Ron | -- | Stewart Title Company | |
| Secretary Of Housing & Urban Development | -- | None Available | |
| Bullock Walter L | $134,000 | Professional National Title |
Source: Public Records
Mortgage History
| Date | Status | Borrower | Loan Amount |
|---|---|---|---|
| Open | Gates Eloise M | $86,310 | |
| Previous Owner | Bullock Walter L | $129,209 |
Source: Public Records
Tax History Compared to Growth
Tax History
| Year | Tax Paid | Tax Assessment Tax Assessment Total Assessment is a certain percentage of the fair market value that is determined by local assessors to be the total taxable value of land and additions on the property. | Land | Improvement |
|---|---|---|---|---|
| 2024 | $4,351 | $14,000 | $2,502 | $11,498 |
| 2023 | $4,297 | $14,000 | $2,502 | $11,498 |
| 2022 | $4,297 | $11,436 | $2,144 | $9,292 |
| 2021 | $4,319 | $11,435 | $2,144 | $9,291 |
| 2020 | $4,438 | $11,435 | $2,144 | $9,291 |
| 2019 | $3,487 | $9,842 | $1,965 | $7,877 |
| 2018 | $3,312 | $9,842 | $1,965 | $7,877 |
| 2017 | $3,372 | $9,842 | $1,965 | $7,877 |
| 2016 | $3,346 | $8,822 | $1,787 | $7,035 |
| 2015 | $3,181 | $8,822 | $1,787 | $7,035 |
| 2014 | $3,153 | $8,822 | $1,787 | $7,035 |
| 2013 | $3,279 | $9,823 | $1,787 | $8,036 |
Source: Public Records
Map
Nearby Homes
- 40 N Elm Ln
- 110 N Oak Ln
- 51 N Pine Ln
- 130 N Oak Ln
- 231 E Tulip Dr
- 127 N Cedar Ln
- 126 N Pine Ln
- 304 E Birch Dr
- 40 N Sycamore Ln
- 350 E Tulip Dr
- 349 E Maple Dr
- 120 S Chestnut Ln
- 113 N Rebecca St
- 23 N Wabash Ave
- 126 S Campbell Ave
- 424 E Clark St
- 19119 S Saint Lawrence Ave
- 108 Campbell Ave
- 225 S Willow St
- 528 E 191st Place