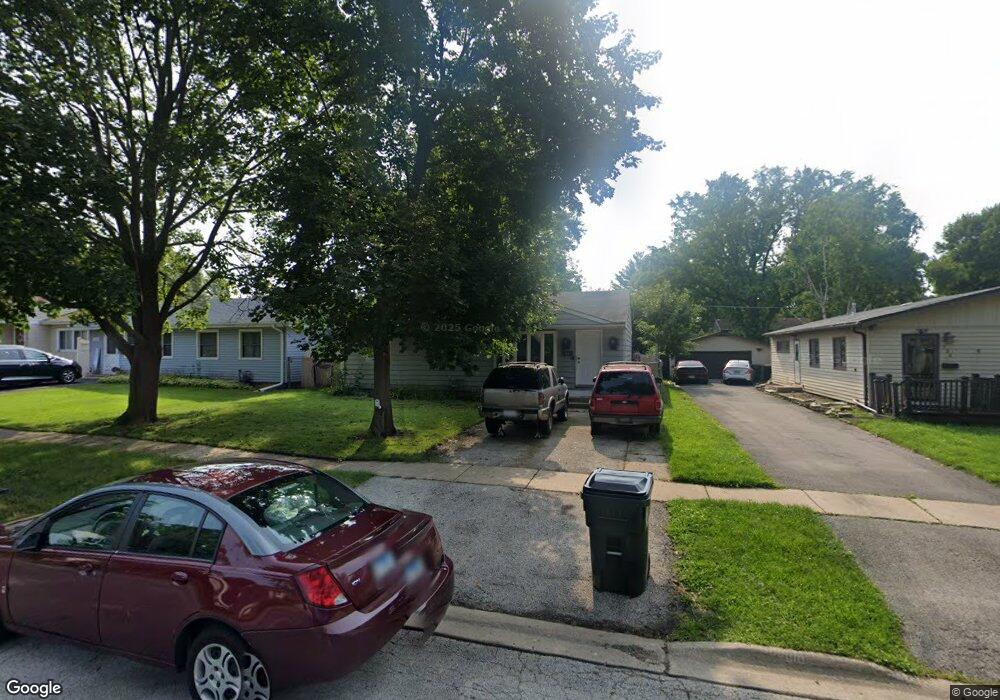
116 N Idlewild Ave Mundelein, IL 60060
Estimated Value: $254,000 - $301,000
3
Beds
2
Baths
975
Sq Ft
$286/Sq Ft
Est. Value
About This Home
This home is located at 116 N Idlewild Ave, Mundelein, IL 60060 and is currently estimated at $279,135, approximately $286 per square foot. 116 N Idlewild Ave is a home located in Lake County with nearby schools including Washington Early Learning Center, Mechanics Grove Elementary School, and Carl Sandburg Middle School.
Ownership History
Date
Name
Owned For
Owner Type
Purchase Details
Closed on
Jan 2, 2009
Sold by
Ferreria Sally S
Bought by
Ferreria Sally S and Rivera Sammy
Current Estimated Value
Home Financials for this Owner
Home Financials are based on the most recent Mortgage that was taken out on this home.
Original Mortgage
$110,398
Outstanding Balance
$70,190
Interest Rate
5.29%
Mortgage Type
FHA
Estimated Equity
$208,945
Purchase Details
Closed on
Nov 26, 2007
Sold by
Wayne Hummer Trust Co Na
Bought by
Ferreria Sally S
Home Financials for this Owner
Home Financials are based on the most recent Mortgage that was taken out on this home.
Original Mortgage
$78,000
Interest Rate
6.33%
Mortgage Type
Purchase Money Mortgage
Purchase Details
Closed on
Jun 25, 2003
Sold by
Ferreria Sally S
Bought by
Wayne Hummer Trust Co and Trust #Lft-1808
Create a Home Valuation Report for This Property
The Home Valuation Report is an in-depth analysis detailing your home's value as well as a comparison with similar homes in the area
Home Values in the Area
Average Home Value in this Area
Purchase History
| Date | Buyer | Sale Price | Title Company |
|---|---|---|---|
| Ferreria Sally S | -- | Aegis Title Services | |
| Ferreria Sally S | -- | None Available | |
| Wayne Hummer Trust Co | -- | -- |
Source: Public Records
Mortgage History
| Date | Status | Borrower | Loan Amount |
|---|---|---|---|
| Open | Ferreria Sally S | $110,398 | |
| Closed | Ferreria Sally S | $78,000 |
Source: Public Records
Tax History Compared to Growth
Tax History
| Year | Tax Paid | Tax Assessment Tax Assessment Total Assessment is a certain percentage of the fair market value that is determined by local assessors to be the total taxable value of land and additions on the property. | Land | Improvement |
|---|---|---|---|---|
| 2024 | $4,672 | $71,572 | $15,690 | $55,882 |
| 2023 | $5,270 | $65,578 | $14,376 | $51,202 |
| 2022 | $5,270 | $59,988 | $12,620 | $47,368 |
| 2021 | $5,012 | $57,887 | $12,178 | $45,709 |
| 2020 | $4,907 | $56,294 | $11,843 | $44,451 |
| 2019 | $4,733 | $54,443 | $11,454 | $42,989 |
| 2018 | $3,955 | $47,487 | $10,775 | $36,712 |
| 2017 | $3,890 | $45,992 | $10,436 | $35,556 |
| 2016 | $3,742 | $43,682 | $9,912 | $33,770 |
| 2015 | $3,586 | $40,950 | $9,292 | $31,658 |
| 2014 | $4,780 | $40,691 | $9,209 | $31,482 |
| 2012 | $4,898 | $41,052 | $9,291 | $31,761 |
Source: Public Records
Map
Nearby Homes
- 207 N Idlewild Ave
- 250 N Fairlawn Ave
- 116 S Pershing Ave
- 1297 Spalding Dr
- 26220 N Midlothian Rd
- 1305 Spalding Dr
- 547 N Ridgemoor Ave
- 201 Bingham Cir
- 208 Bingham Cir
- 29746 U S 45
- 851 Glenview Ave
- 619 N California Ave Unit 1
- 1360 Edington Ln
- 123 Dunton Ct
- 728 W Maple Ave
- 26980 N Pierre Dr
- 19925 W Il Route 60
- 331 Plaza Cir
- 26892 N Iride Dr
- 742 N Lake St
- 122 N Idlewild Ave
- 110 N Idlewild Ave
- 128 N Idlewild Ave
- 104 N Idlewild Ave
- 115 N Ridgemoor Ave
- 109 N Ridgemoor Ave
- 134 N Idlewild Ave
- 121 N Ridgemoor Ave
- 840 W Crystal St
- 127 N Ridgemoor Ave
- 115 N Idlewild Ave
- 140 N Idlewild Ave
- 121 N Idlewild Ave
- 109 N Idlewild Ave
- 70 N Idlewild Ave
- 127 N Idlewild Ave
- 103 N Idlewild Ave
- 133 N Ridgemoor Ave
- 133 N Idlewild Ave
- 865 W Crystal St