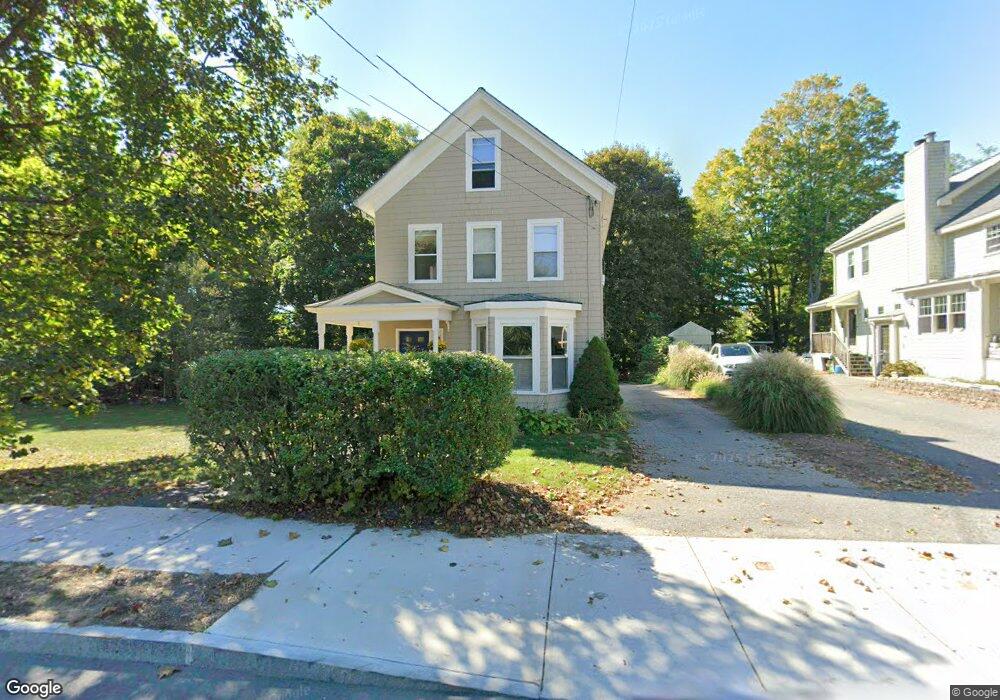
116 N Main St Natick, MA 01760
Estimated Value: $677,000 - $856,000
4
Beds
2
Baths
1,540
Sq Ft
$490/Sq Ft
Est. Value
About This Home
This home is located at 116 N Main St, Natick, MA 01760 and is currently estimated at $754,333, approximately $489 per square foot. 116 N Main St is a home located in Middlesex County with nearby schools including Natick High School, Wilson Middle School, and Bennett-Hemenway (Ben-Hem) Elementary School.
Ownership History
Date
Name
Owned For
Owner Type
Purchase Details
Closed on
Mar 16, 2000
Sold by
Malcolm Roger A
Bought by
Miller Jason W and Miller Gail A
Current Estimated Value
Purchase Details
Closed on
Sep 7, 1990
Sold by
Baltic Rlty Corp Tr
Bought by
Malcolm Roger A
Purchase Details
Closed on
Apr 18, 1990
Sold by
Oconnell Marion L
Bought by
Baltic Rlty Corp Tr
Create a Home Valuation Report for This Property
The Home Valuation Report is an in-depth analysis detailing your home's value as well as a comparison with similar homes in the area
Home Values in the Area
Average Home Value in this Area
Purchase History
| Date | Buyer | Sale Price | Title Company |
|---|---|---|---|
| Miller Jason W | $263,000 | -- | |
| Malcolm Roger A | $120,000 | -- | |
| Baltic Rlty Corp Tr | $2,000 | -- |
Source: Public Records
Mortgage History
| Date | Status | Borrower | Loan Amount |
|---|---|---|---|
| Open | Baltic Rlty Corp Tr | $302,000 | |
| Closed | Baltic Rlty Corp Tr | $300,000 |
Source: Public Records
Tax History
| Year | Tax Paid | Tax Assessment Tax Assessment Total Assessment is a certain percentage of the fair market value that is determined by local assessors to be the total taxable value of land and additions on the property. | Land | Improvement |
|---|---|---|---|---|
| 2025 | $6,987 | $584,200 | $377,400 | $206,800 |
| 2024 | $6,725 | $548,500 | $355,100 | $193,400 |
| 2023 | $7,125 | $563,700 | $340,300 | $223,400 |
| 2022 | $6,839 | $512,700 | $308,100 | $204,600 |
| 2021 | $6,567 | $482,500 | $290,500 | $192,000 |
| 2020 | $6,387 | $469,300 | $277,300 | $192,000 |
| 2019 | $5,965 | $469,300 | $277,300 | $192,000 |
| 2018 | $5,785 | $443,300 | $264,100 | $179,200 |
| 2017 | $5,451 | $404,100 | $228,100 | $176,000 |
| 2016 | $5,219 | $384,600 | $210,300 | $174,300 |
| 2015 | $5,120 | $370,500 | $210,300 | $160,200 |
Source: Public Records
Map
Nearby Homes
- 7 Jackson Ct Unit B
- 27 2nd St
- 293 Bacon St Unit A
- 36 Winnemay St
- 9 Bellevue Rd
- 49 Summer St
- 89 W Central St
- 20 Florence St Unit B
- 45 Summer St
- 16 Harvard St
- 17 Florence St
- 7 High St
- 63 Pond St
- 5 Reynolds Ave Unit 2
- 50 Wethersfield Rd
- 3 Wilson St Unit 3B
- 3 Vale St Unit A
- 4B Lincoln St Unit 4B
- 6A Lincoln St Unit 6A
- 53 Harvard Street Extension
- 118 N Main St
- 120 N Main St
- 117 N Main St
- 117 N Main St Unit B
- 117 N Main St Unit A
- 119 N Main St Unit B
- 119 N Main St Unit A
- 115 N Main St
- 122 N Main St
- 124 N Main St
- 127 N Main St
- 113 N Main St
- 126 N Main St Unit 1
- 126 N Main St
- 126 N Main St Unit 2
- 18 Franconia Ave
- 129 N Main St
- 20 Franconia Ave
- 12 Franconia Ave
- 2 Fisher St
Your Personal Tour Guide
Ask me questions while you tour the home.